MLflow Tracing for LLM Observability
MLflow Tracing enhances LLM observability in your applications by capturing the inputs, outputs, and metadata associated with each intermediate step of a request, enabling you to easily pinpoint the source of bugs and unexpected behaviors.
Use Cases Throughout the ML Lifecycle
MLflow Tracing empowers you throughout the end-to-end lifecycle of a machine learning project. Here's how it helps you at each step of the workflow, click on the tabs below to learn more:
- Build & Debug
- Human Feedback
- Evaluation
- Production Monitoring
- Dataset Collection
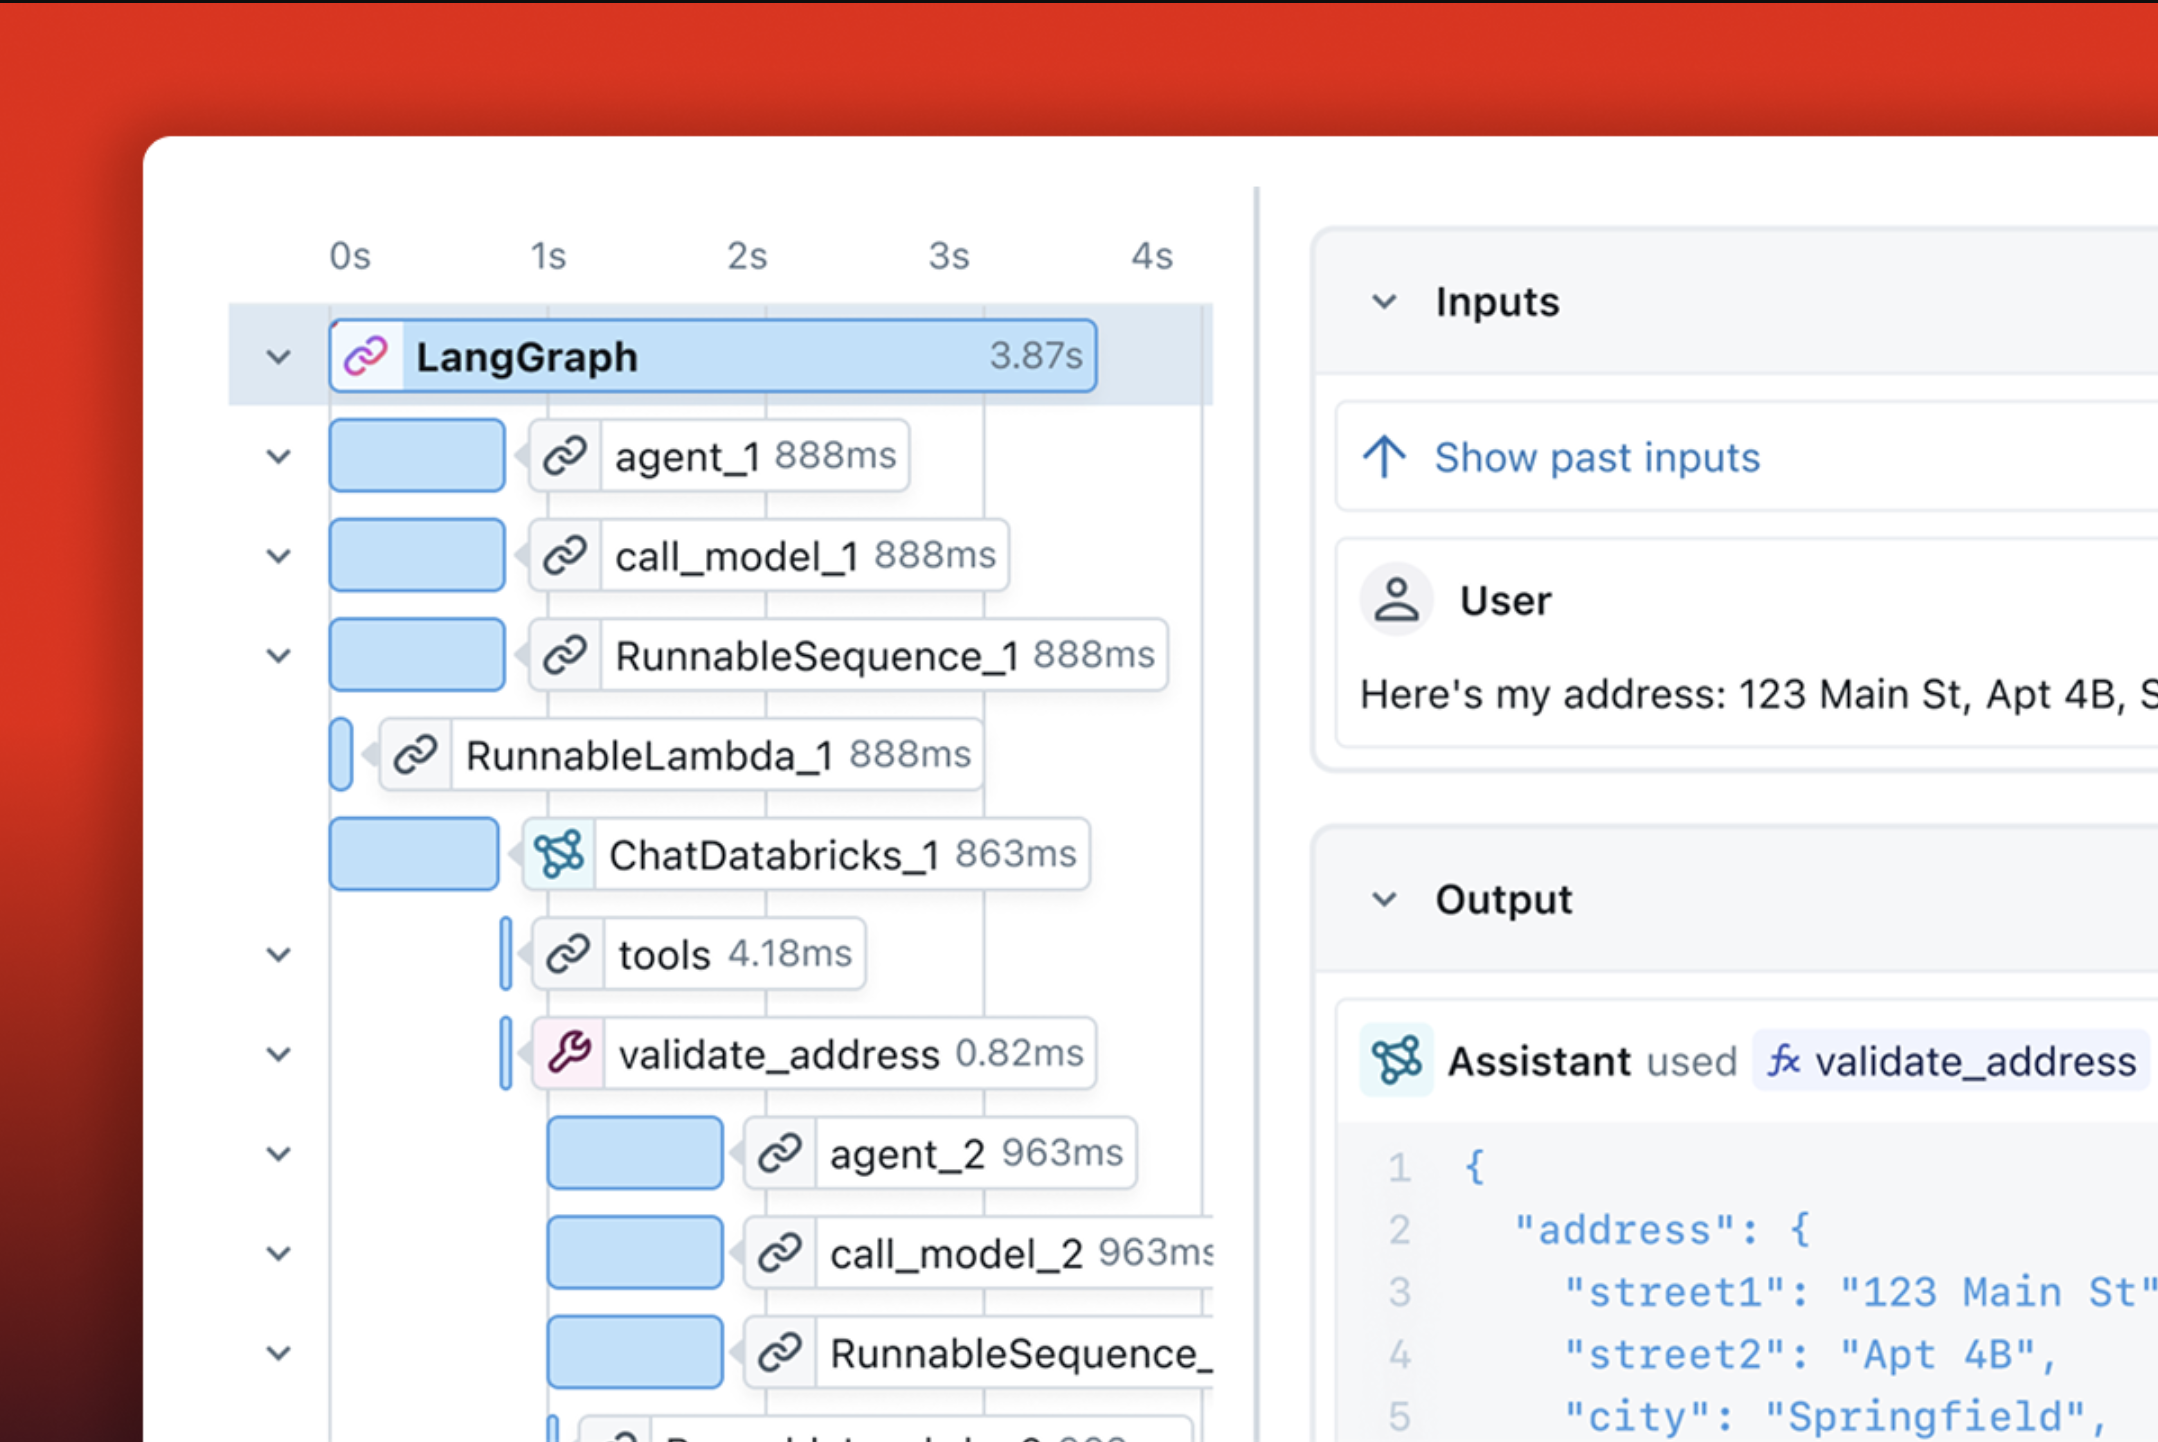
Debug Issues in Your IDE or Notebook
Traces provide deep insights into what happens beneath the abstractions of GenAI libraries, helping you precisely identify where issues occur.
You can navigate traces seamlessly within your preferred IDE, notebook, or the MLflow UI, eliminating the hassle of switching between multiple tabs or searching through an overwhelming list of traces.
Track Annotation and Human Feedbacks
Human feedback is essential for building high-quality GenAI applications that meet user expectations. MLflow supports collecting, managing, and utilizing feedback from end-users and domain experts.
Feedbacks are attached to traces and recorded with metadata, including user, timestamp, revisions, etc.
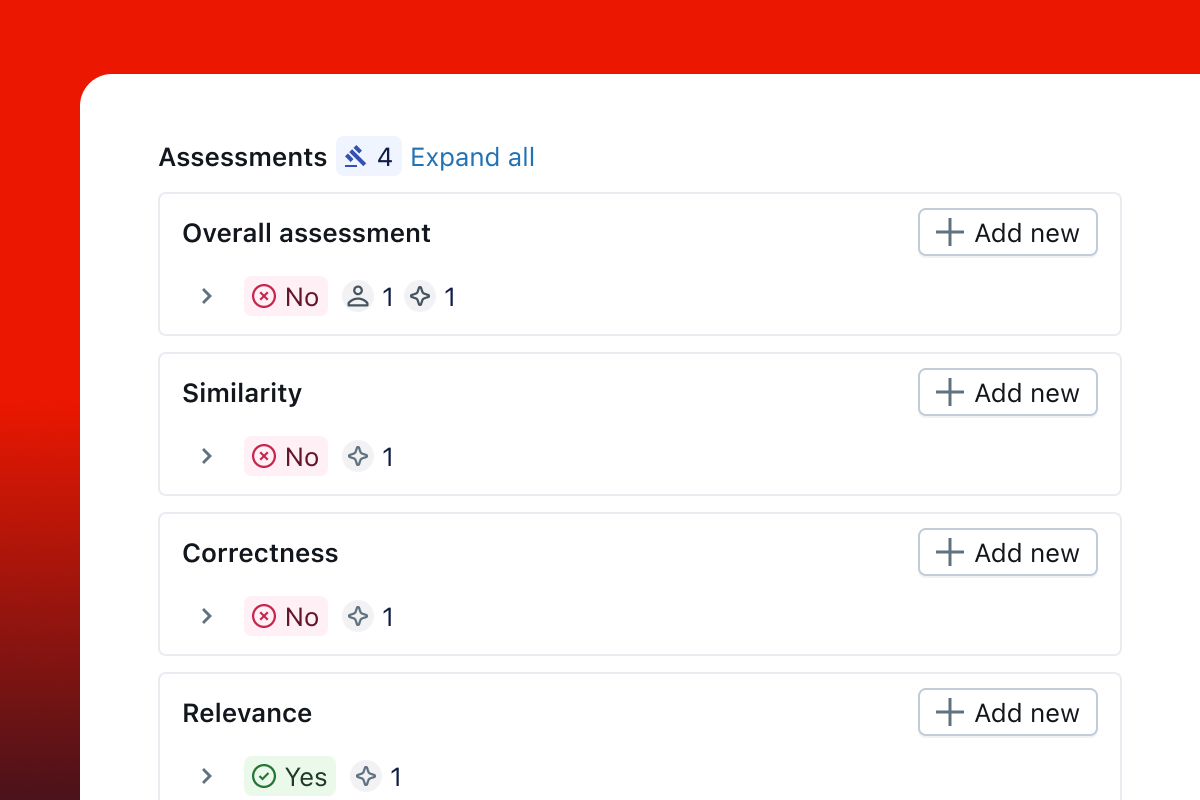
Evaluate and Enhance Quality
Systematically assessing and improving the quality of GenAI applications is a challenge. Combined with MLflow GenAI Evaluation, MLflow offers a seamless experience for evaluating your applications.
Tracing helps by allowing you to track quality assessment and inspect the evaluation results with visibility into the internals of the system.
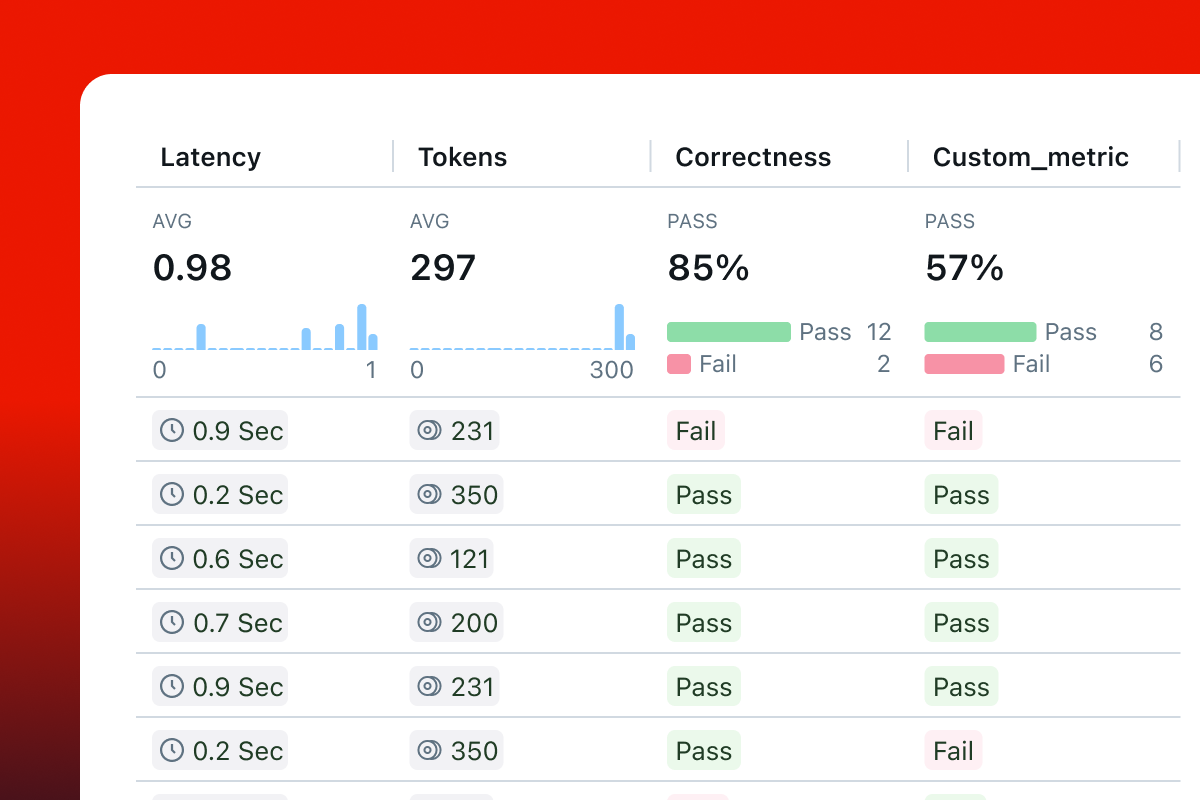
Monitor Applications in Production
Understanding and optimizing GenAI application performance is crucial for efficient operations. MLflow Tracing captures key metrics like latency and token usage at each step, as well as various quality metrics, helping you identify bottlenecks, monitor efficiency, and find optimization opportunities.
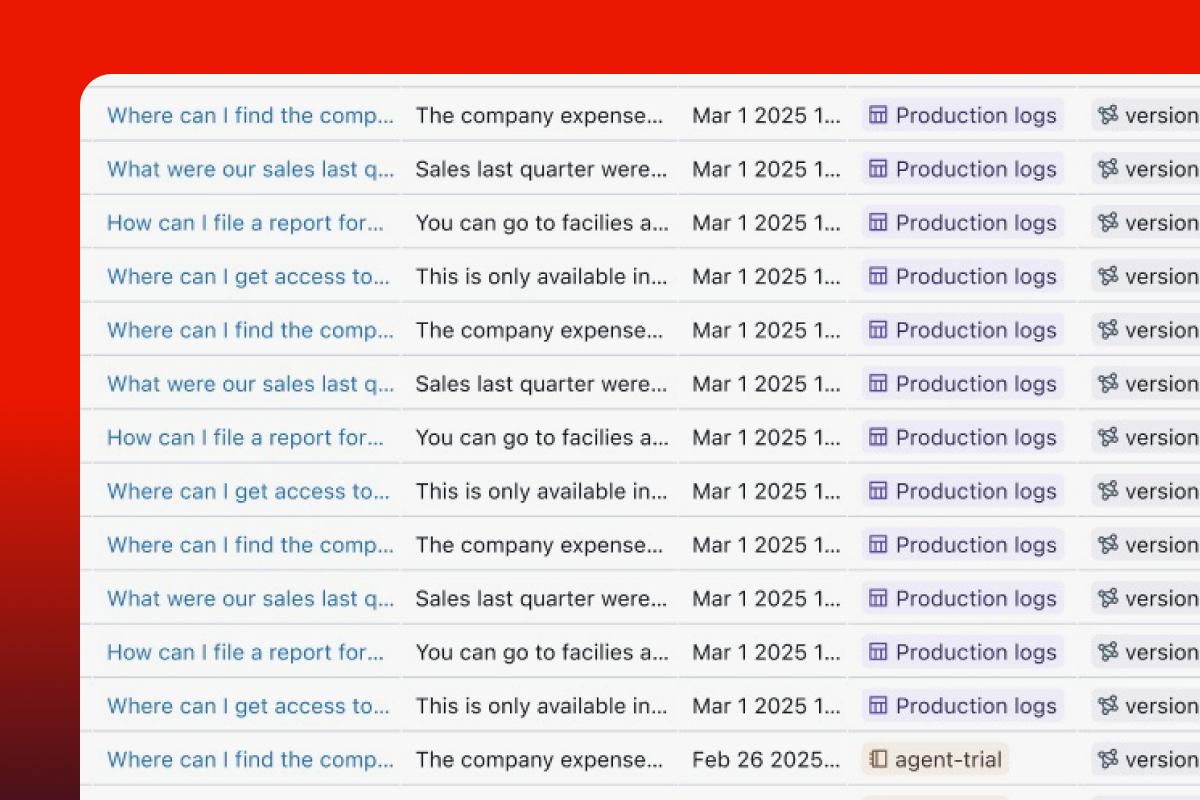
Create a High-Quality Dataset from Real World Traffic
Evaluating the performance of your GenAI application is crucial, but creating a reliable evaluation dataset is challenging.
Traces from production systems capture perfect data for building high-quality datasets with precise details for internal components like retrievers and tools.
What Makes MLflow Tracing Unique?
Open Source
MLflow is open source and 100% FREE. You don't need to pay additional SaaS costs to add observability to your GenAI stack. Your trace data is hosted on your own infrastructure.
OpenTelemetry
MLflow Tracing is compatible with OpenTelemetry, making it free from vendor lock-in and easy to integrate with your existing observability stack.
Framework Agnostic
MLflow Tracing integrates with 20+ GenAI libraries, including OpenAI, LangChain, LlamaIndex, DSPy, Pydantic AI, allowing you to switch between frameworks with ease.
End-to-End Platform
MLflow Tracing empowers you throughout the end-to-end machine learning lifecycle, combined with its version tracking and evaluation capabilities.
Strong Community
MLflow boasts a vibrant Open Source community as a part of the Linux Foundation, with 20K+ GitHub Stars and 20MM+ monthly downloads.
Getting Started
Quickstart (Python)
Get started with MLflow in Python
Quickstart (JS/TS)
Get started with MLflow in JavaScript or TypeScript
Trace Your App
Explore the practical guides for instrumenting your own applications or systems
One-line Auto Tracing Integrations
MLflow Tracing is integrated with various GenAI libraries and provides one-line automatic tracing experience for each library (and combinations of them!):
import mlflow

mlflow.openai.autolog()  # or replace 'openai' with other library names, e.g., "anthropic"
| Frameworks | LLM Providers | Tools |
|---|---|---|
| LangChain • LangGraph • LlamaIndex • DSPy • PydanticAI • AutoGen • OpenAI Agent • AG2 • CrewAI • Smolagents | OpenAI • Anthropic • Bedrock • Gemini • LiteLLM • Ollama • Groq • Mistral • DeepSeek | Instructor • txtai |
For the complete list and detailed integration examples, see the Automatic Tracing documentation.
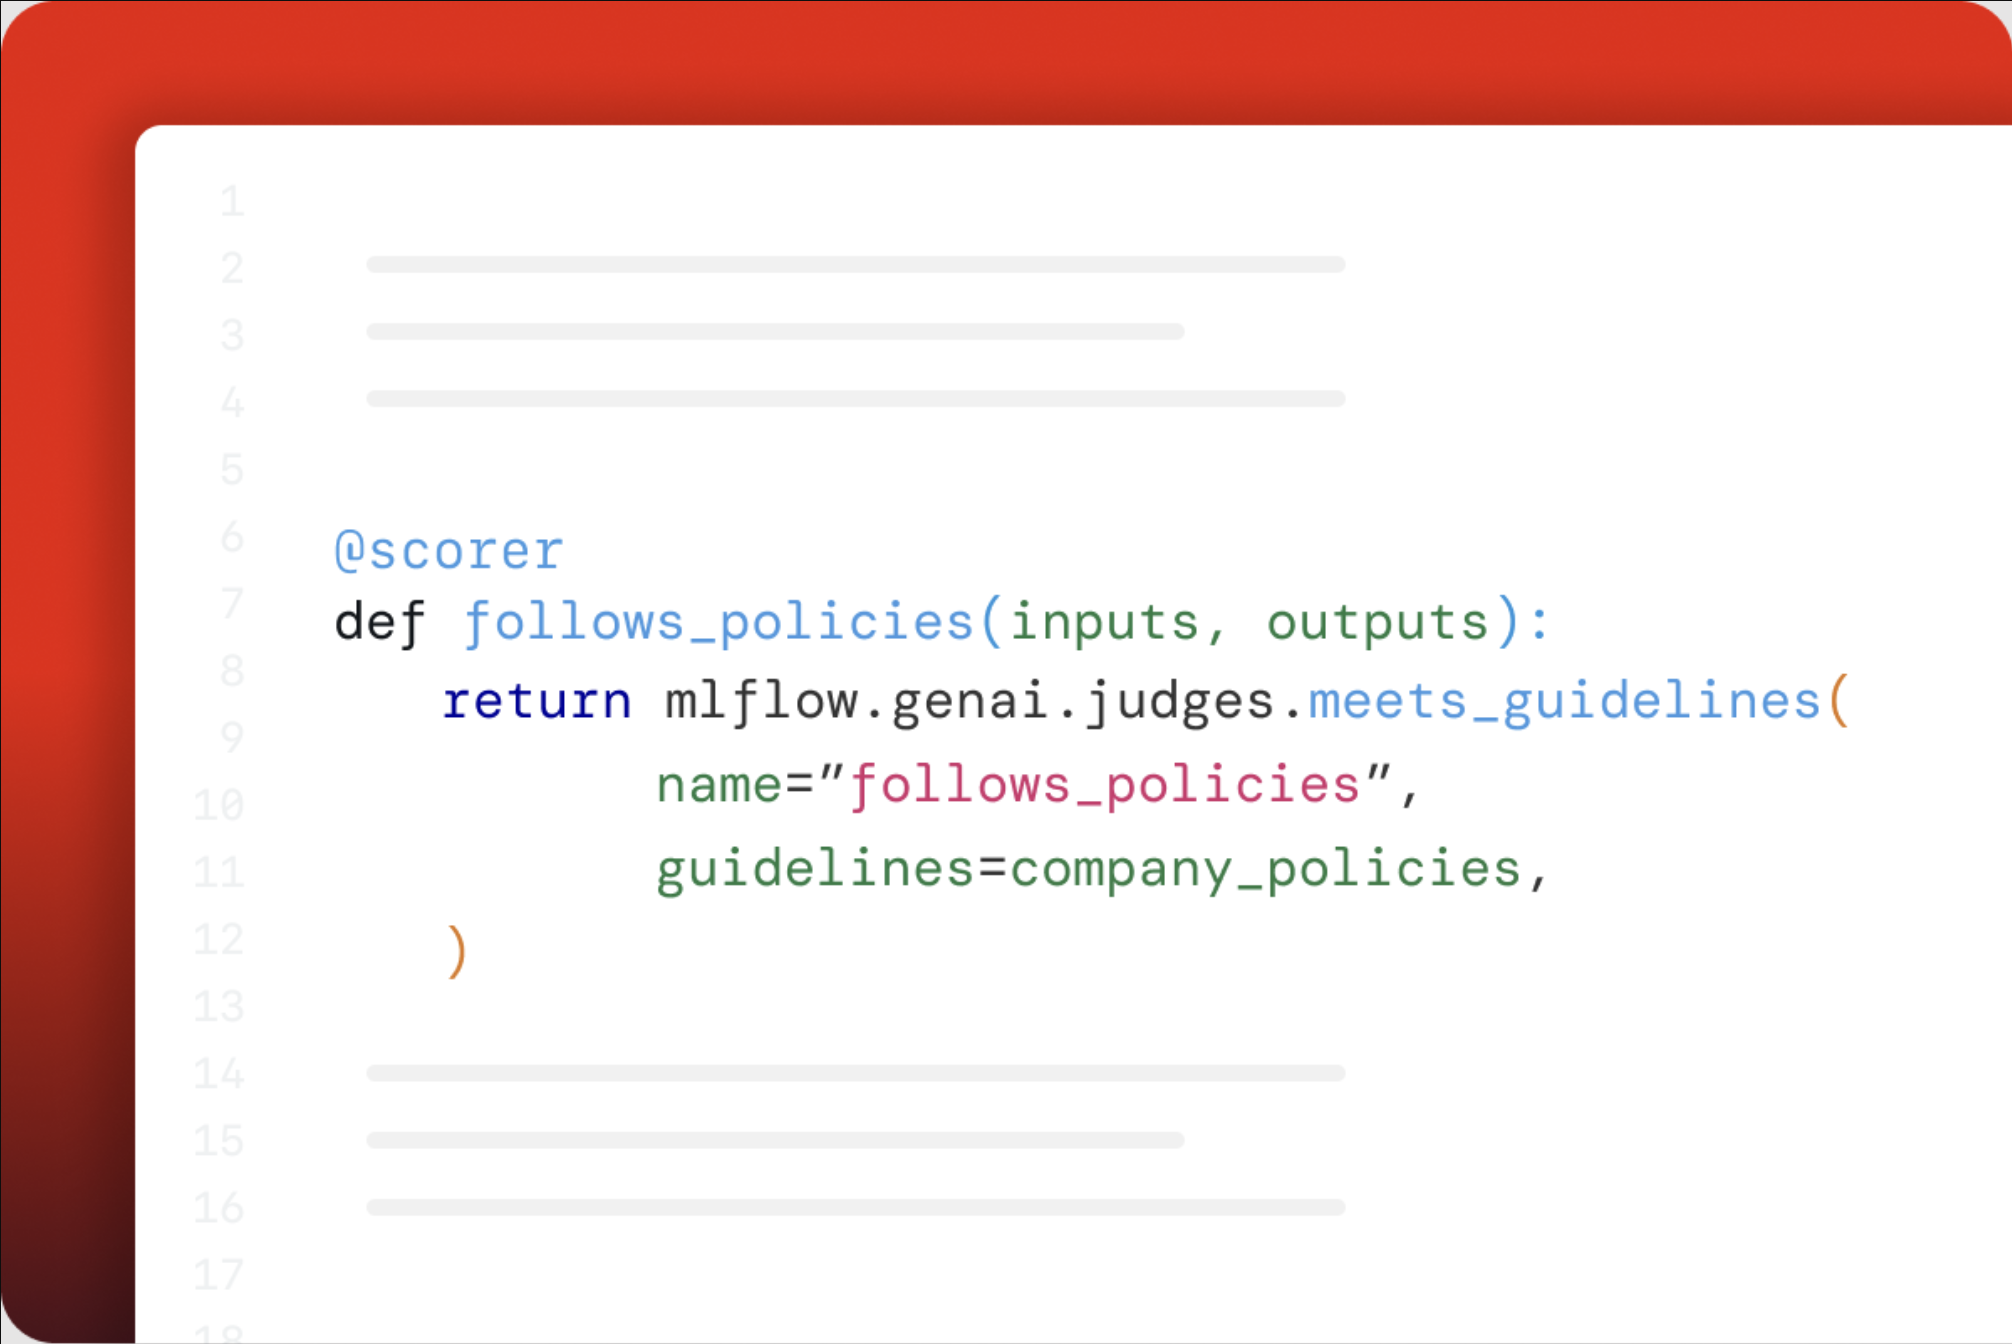
Flexible and Customizable
In addition to the one-line auto tracing experience, MLflow offers Python SDK for manually instrumenting your code and manipulating traces:
- Trace a function with
@mlflow.tracedecorator - Trace any block of code using context manager
- Combine multiple auto-tracing integrations
- Instrument multi-threaded applications
- Native async support
- Group and filter traces using sessions
- Redact PII data from traces
- Disable tracing globally
Production Readiness
MLflow Tracing is production ready and provides comprehensive monitoring capabilities for your GenAI applications in production environments. By enabling async logging, trace logging is done in the background and does not impact the performance of your application.
For production deployments, it is recommended to use the Lightweight Tracing SDK (mlflow-tracing) that is optimized for reducing the total installation size and minimizing dependencies while maintaining full tracing capabilities. Compared to the full mlflow package, the mlflow-tracing package requires 95% smaller footprint.
Read Production Monitoring for complete guidance on using MLflow Tracing for monitoring models in production and various backend configuration options.