Try Managed MLflow
The Databricks Free Trial offers an opportunity to experience the Databricks platform without prior cloud provider access. Most Databricks features, including full MLflow functionality are available during the trial period, allowing you to explore the platform with trial credits. You create account with your email only and won't get charged unless you decide to upgrade to a paid plan and register your payment information.
Start your trial
To get started with Databricks Free Trial, visit the Databricks Trial Signup Page and follow the instructions outlined there. It takes about 5 minutes to set up, after which you'll have access to a nearly fully-functional Databricks Workspace for logging your tutorial experiments, traces, models, and artifacts.
Do you already have a Databricks trial account? Click here if you'd like to login and get back to the MLflow UI.
First Steps
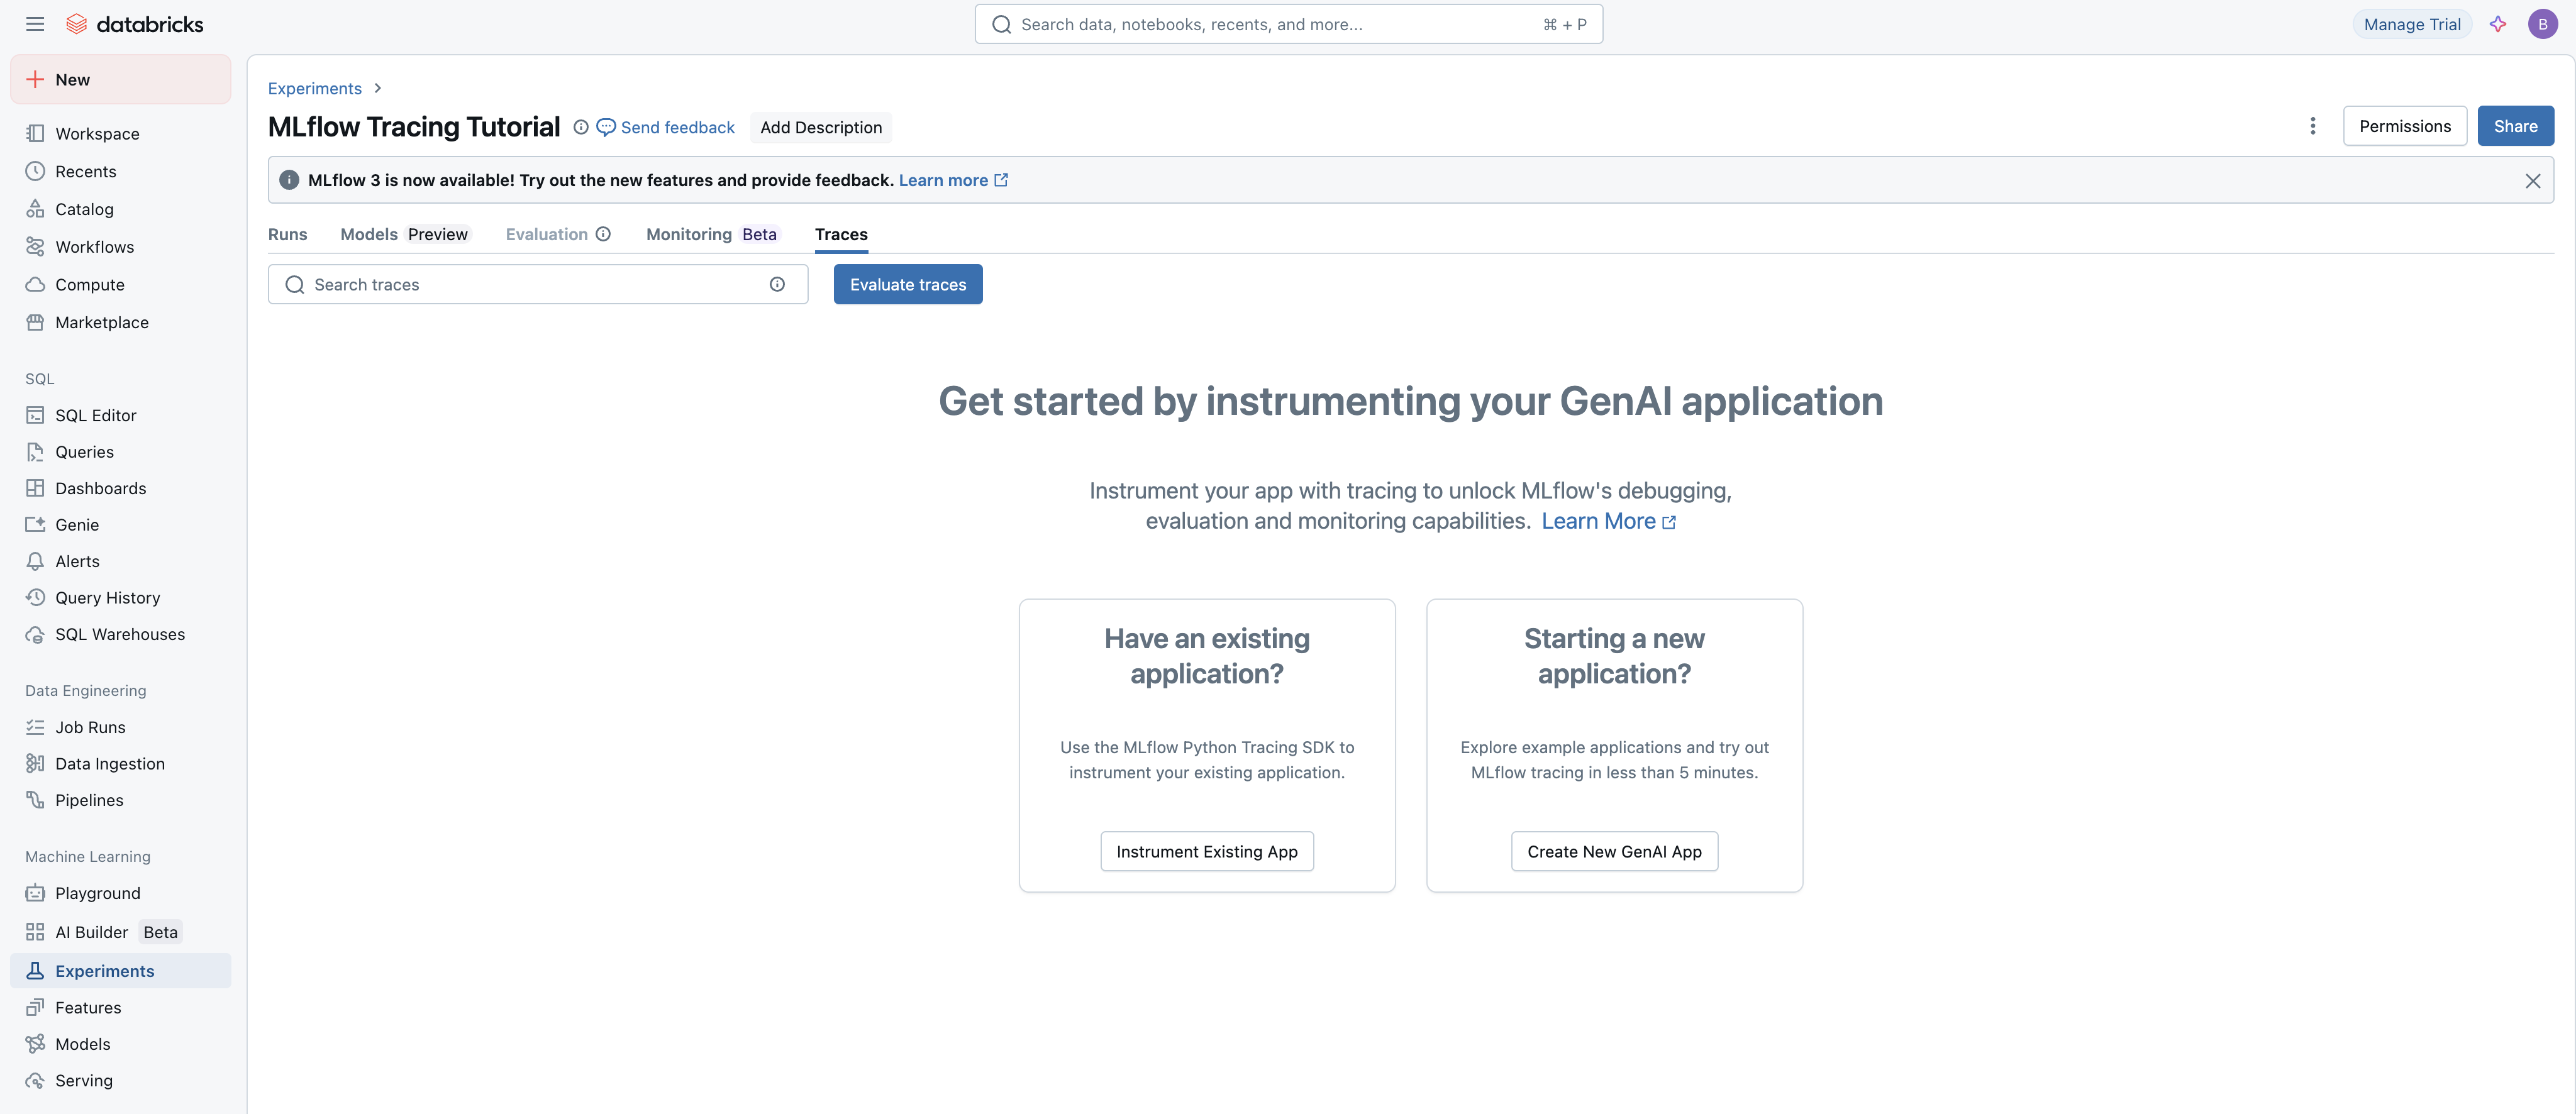
When you login for the first time, you will be directed to the MLflow Tracing tutorial, giving you an opportunity to try out one of the most powerful GenAI features that MLflow has to offer.
Simply click on either of the two tutorials and you will be able to test out MLflow's instrumentation capabilities within minutes.
Navigating the Databricks UI
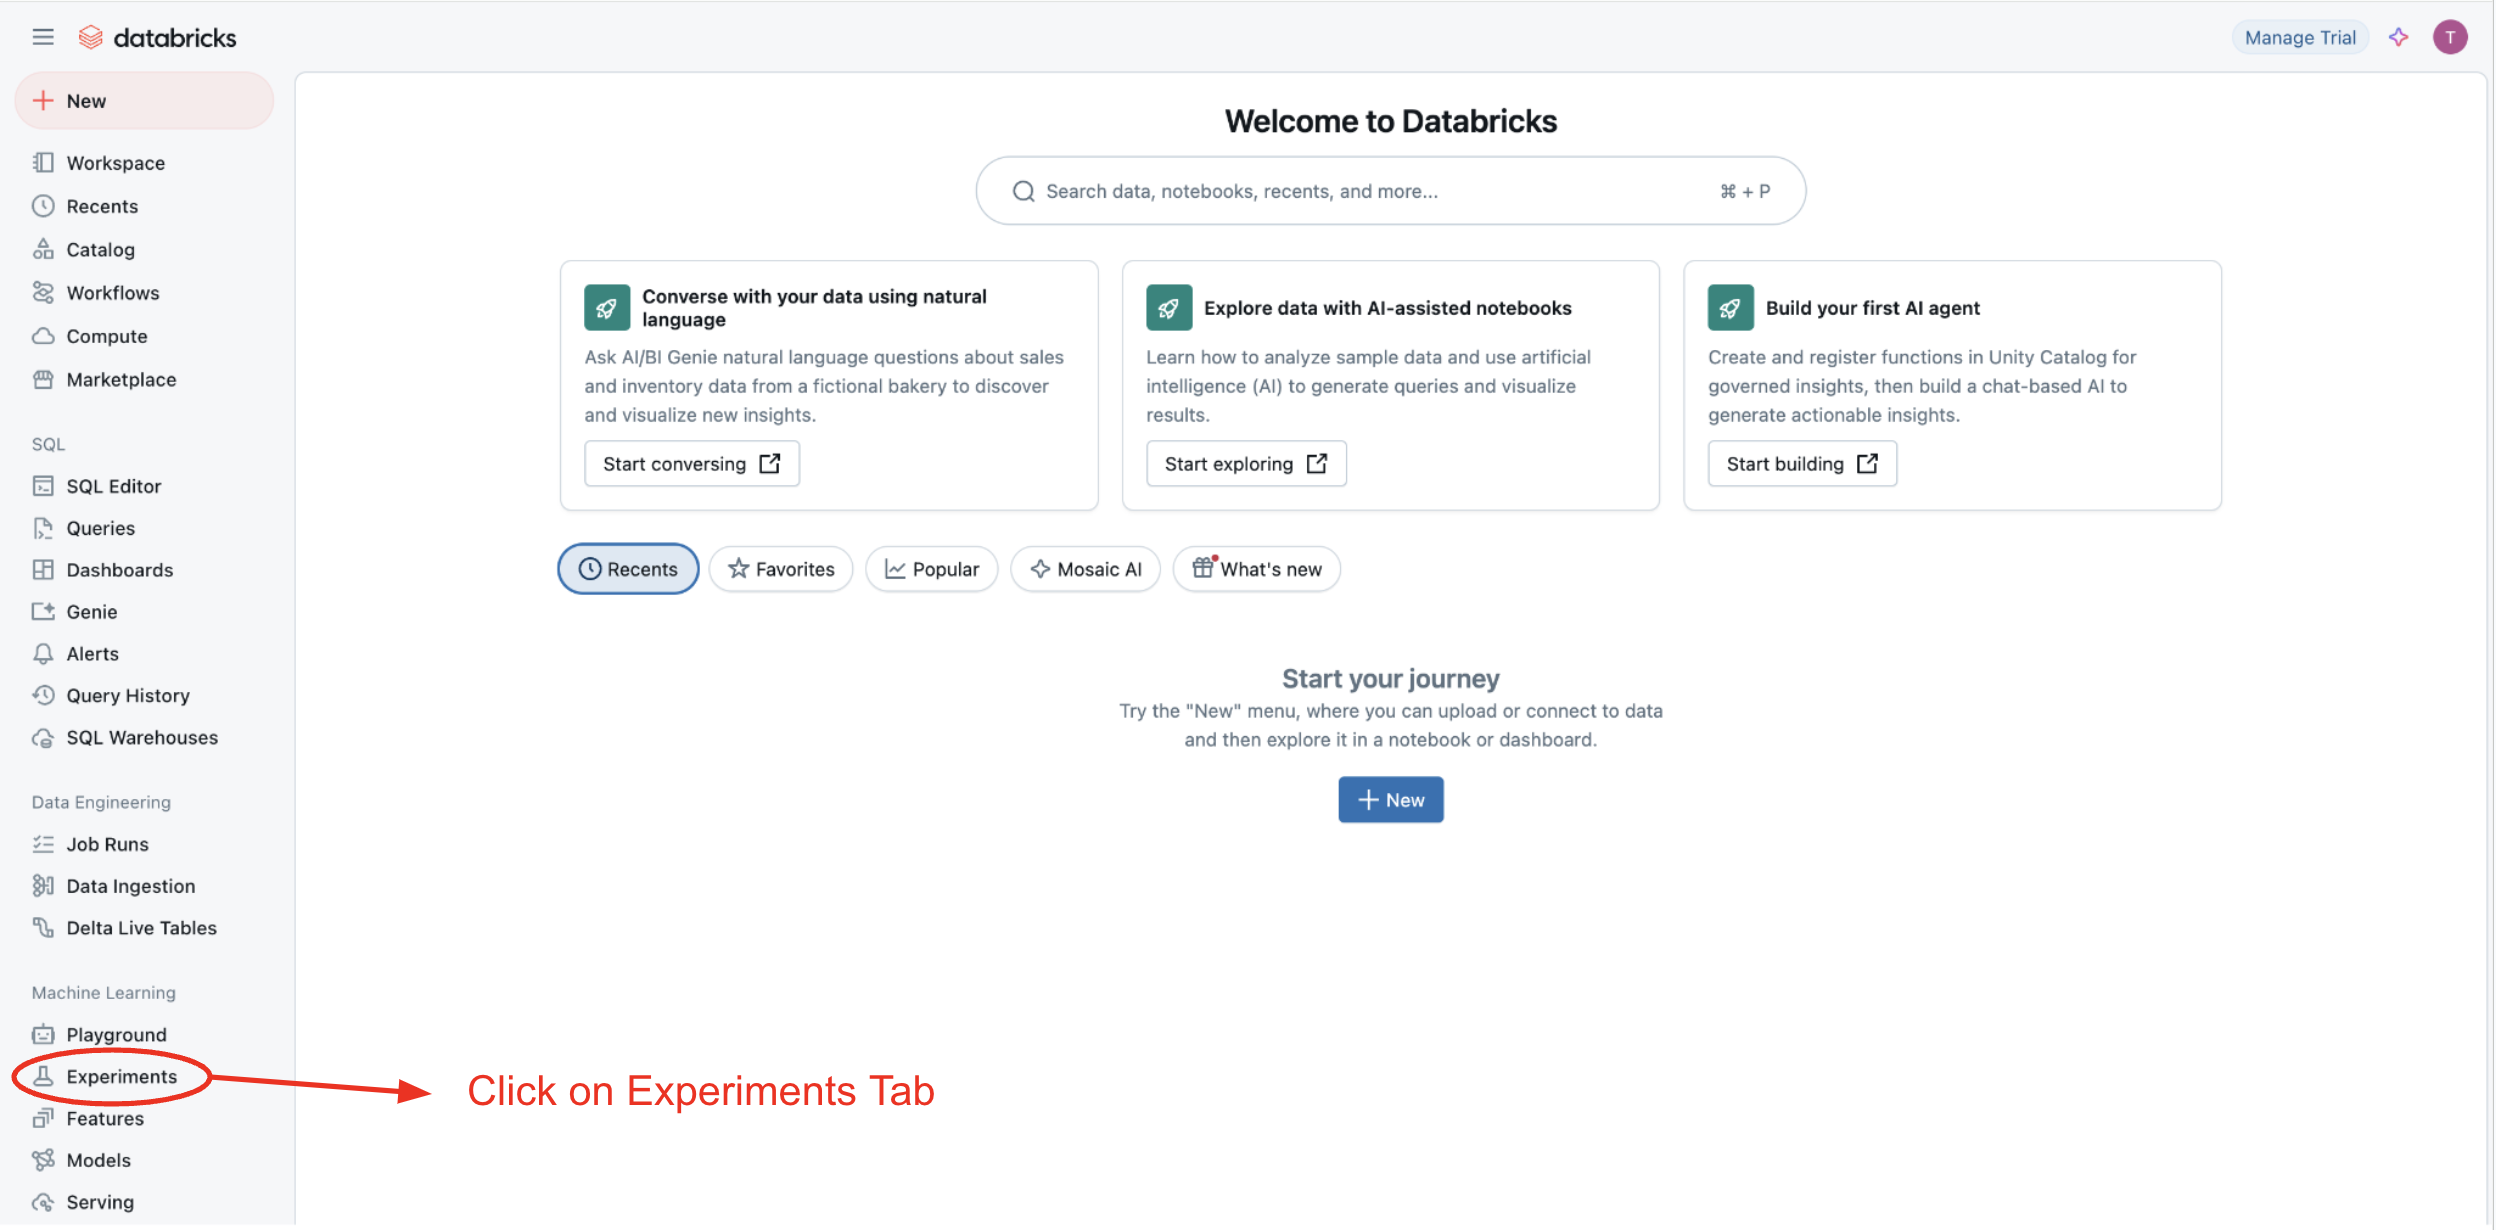
Otherwise, once you log in to the Databricks Workspace on subsequent visits, you will see a landing page like this:
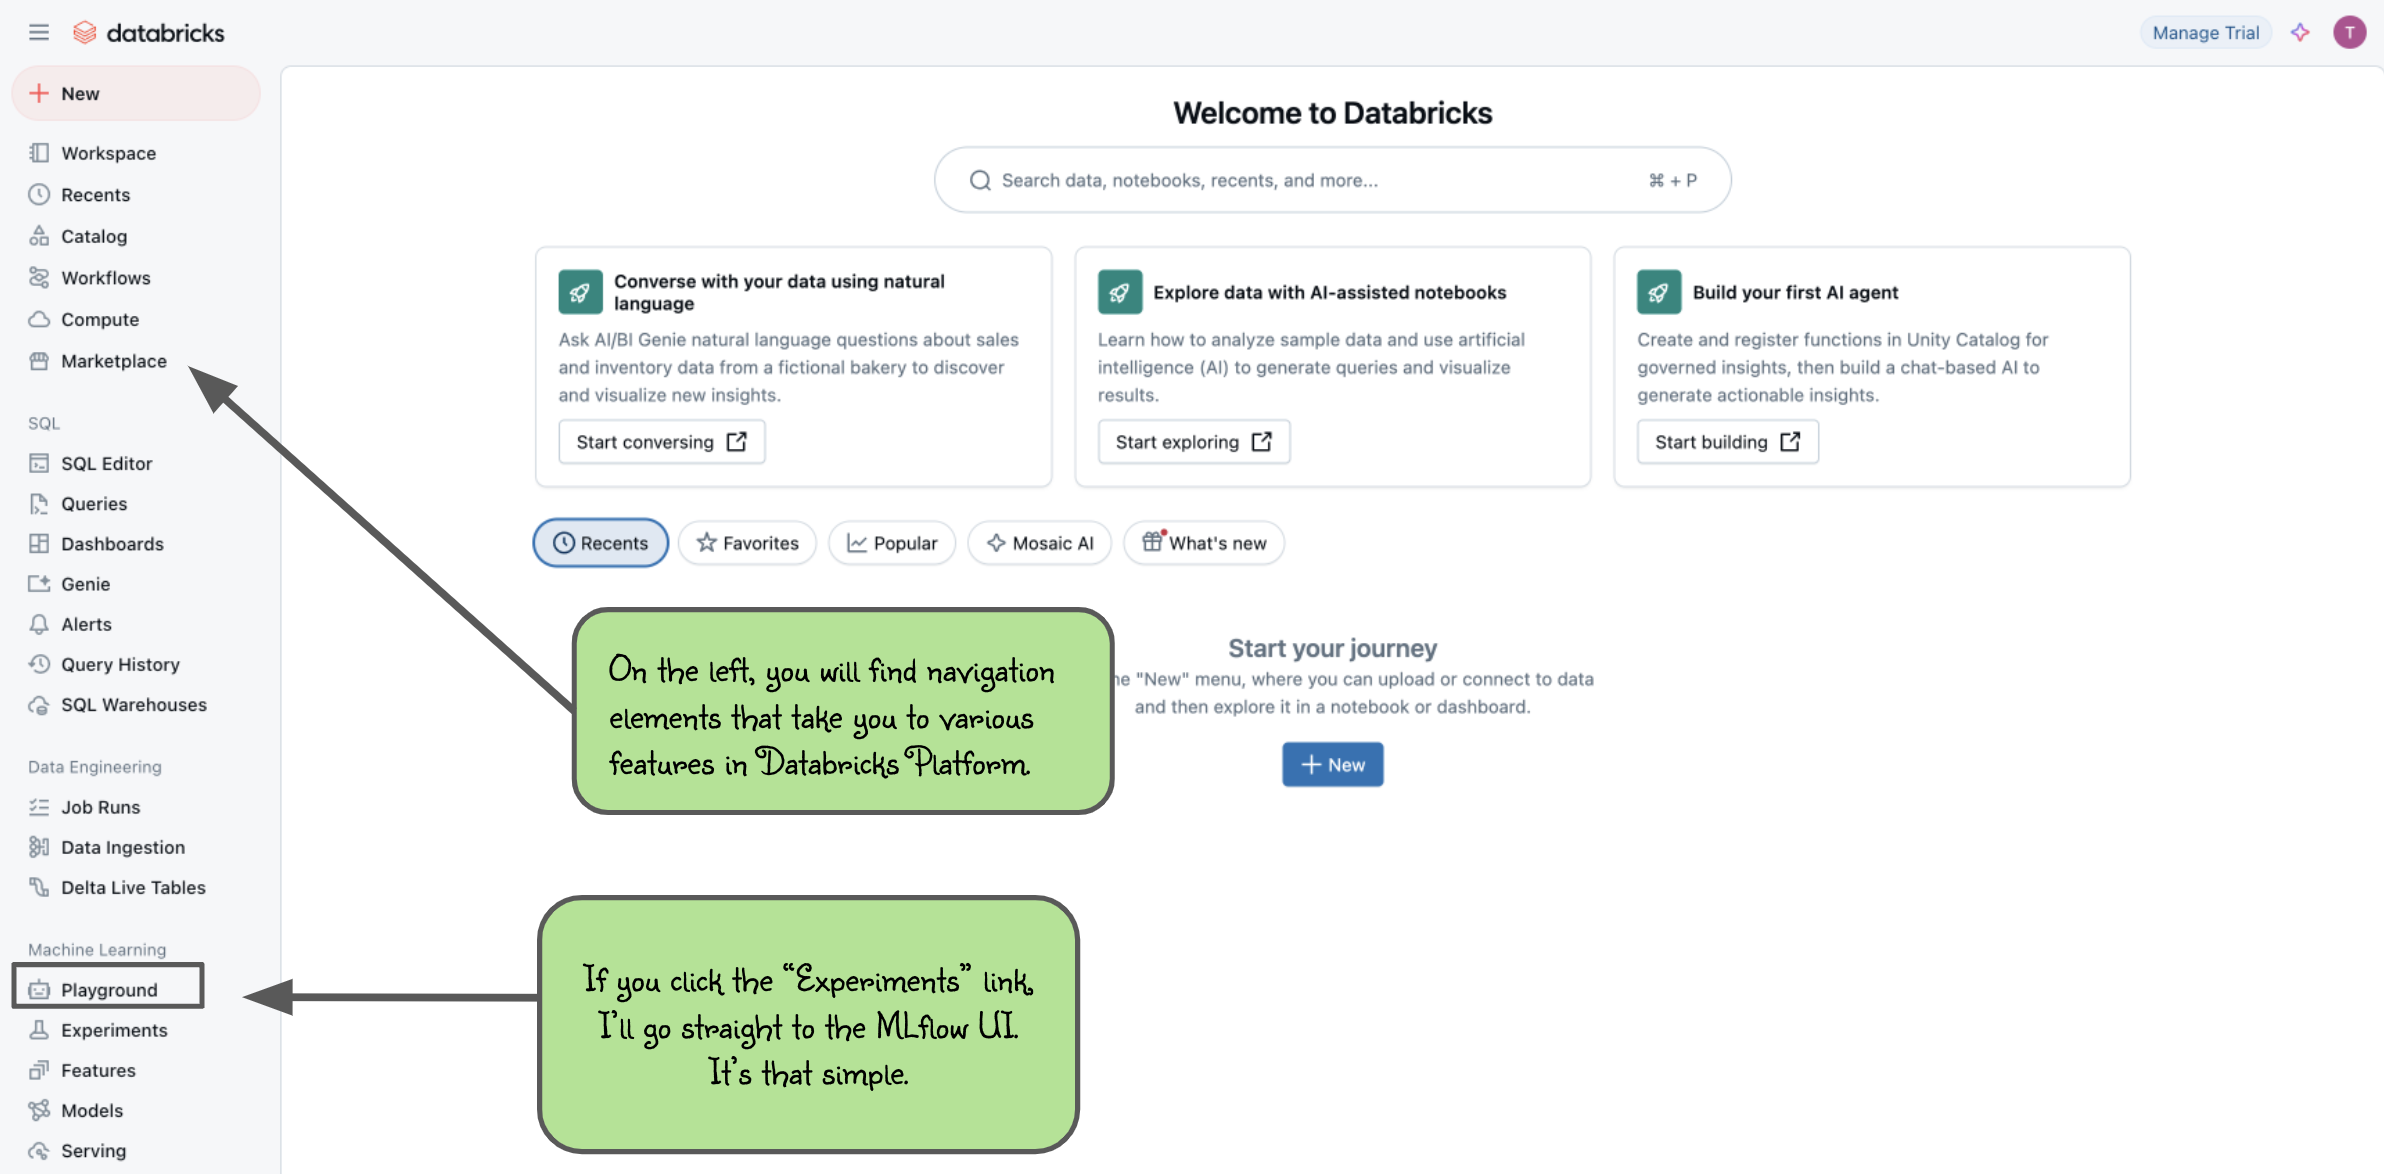
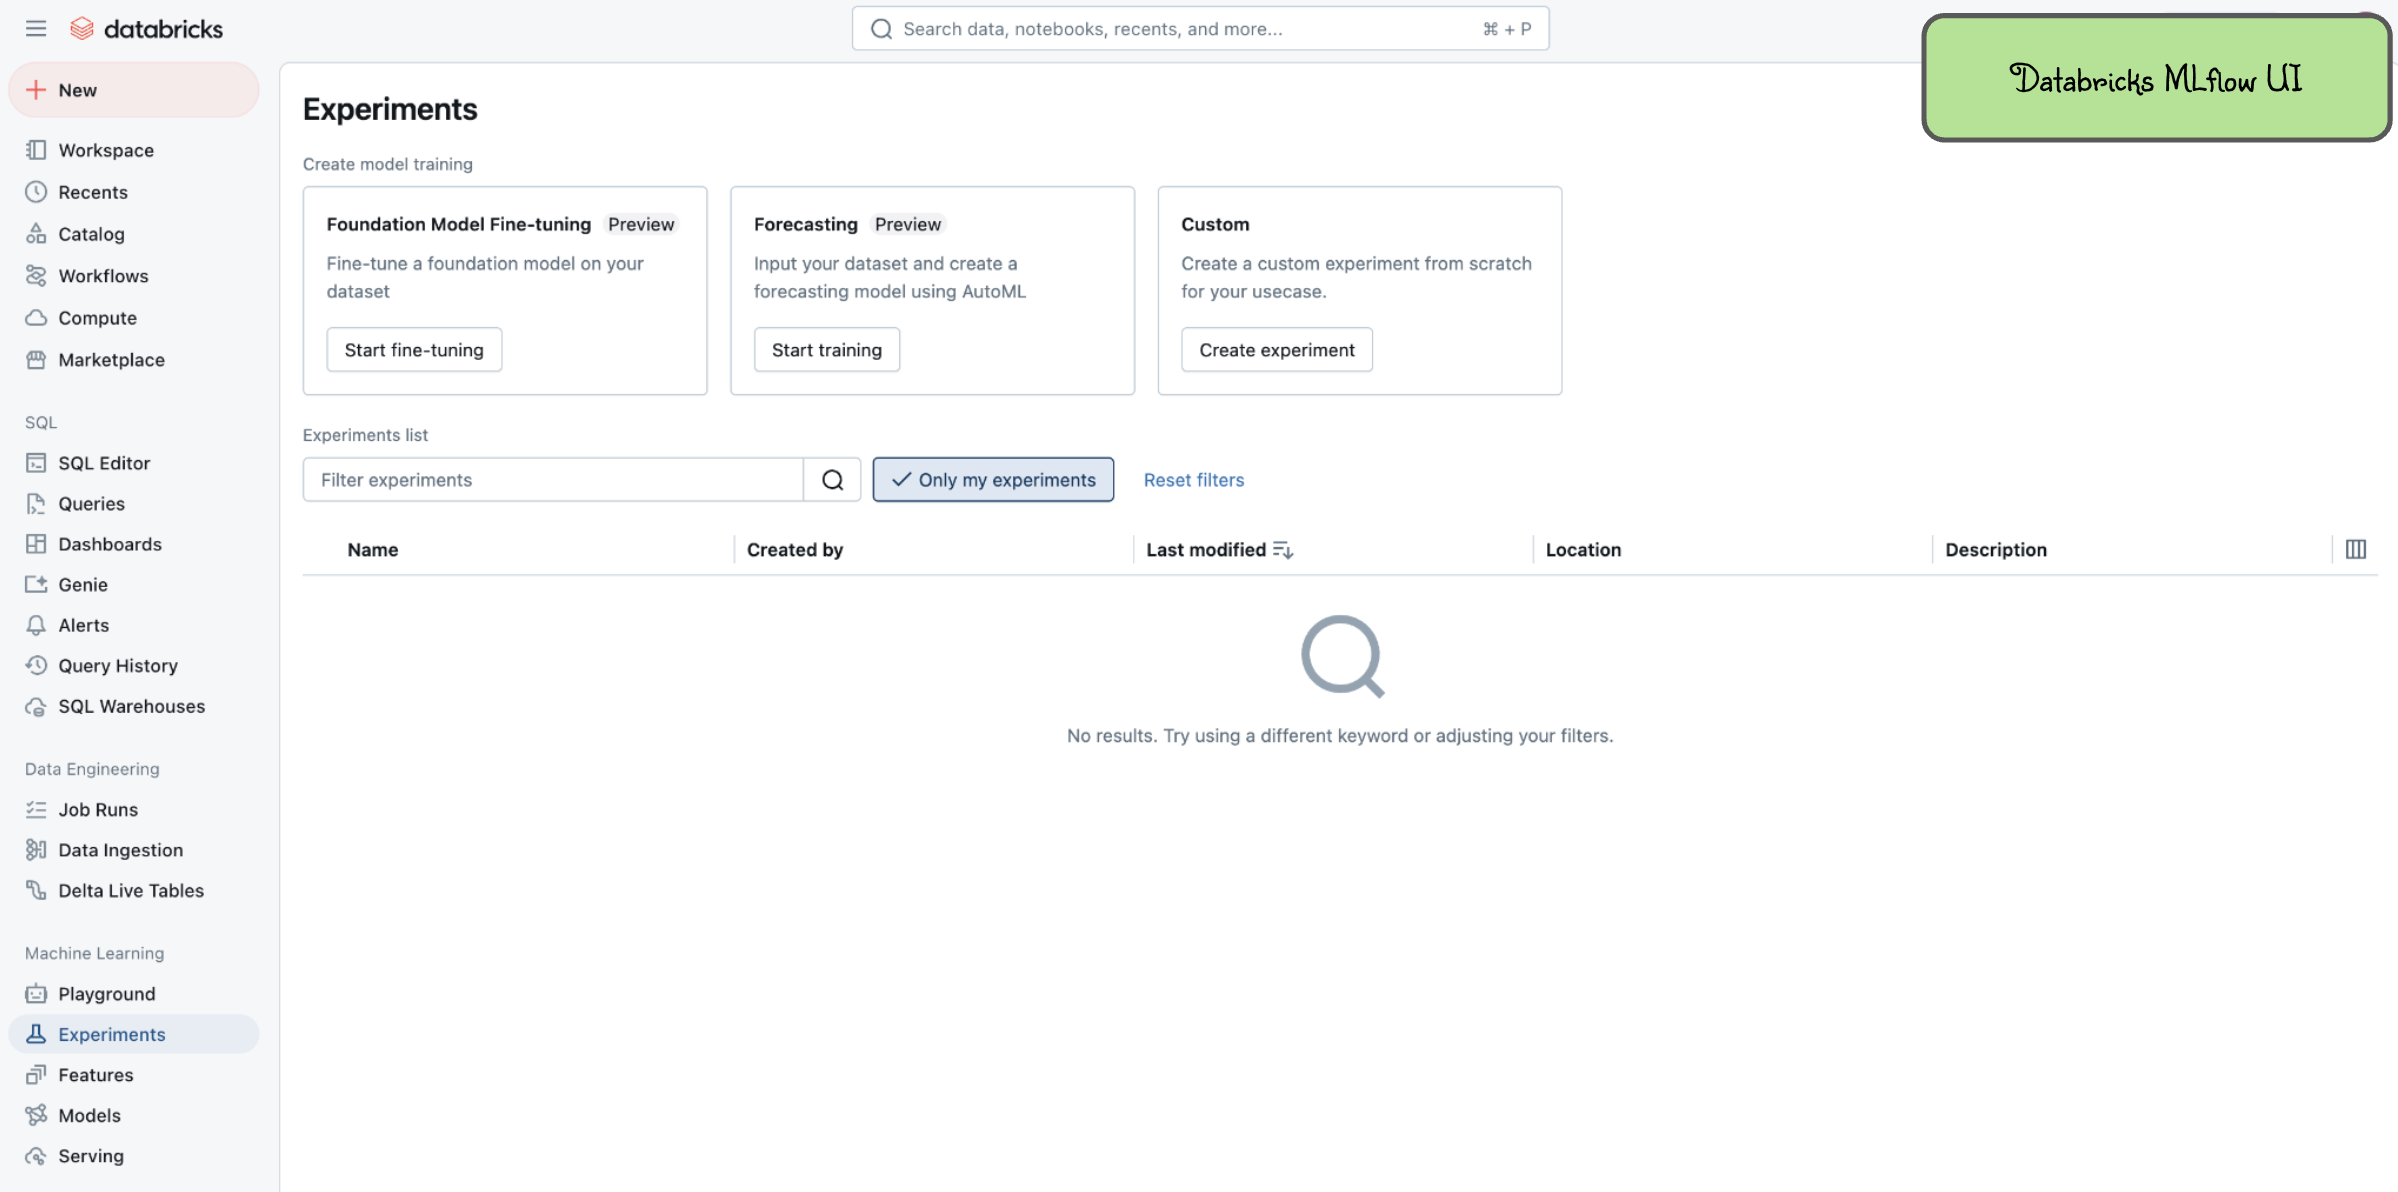
In order to get to the MLflow UI, you can navigate to it by clicking on the "Experiments" link on the left-hand side (denoted by the laboratory beaker icon). When you get to the MLflow UI on Databricks for the first time, you'll see this:
Decisions about where to run your Notebook
With a Databricks managed instance of MLflow, you have two options for running the tutorial notebooks: importing notebooks directly into Databricks Workspace or running notebooks locally and using Databricks Workspace as a remote tracking server.
Importing Notebooks directly into Databricks Workspace
Once you're at the main page of the Databricks Workspace, you can import any of the notebooks within this tutorial.
Firstly, click "Download this Notebook" button in a tutorial page to download the tutorial notebook.
Then navigate to the "Workspace" tab on the left and click that link to open the workspace page.
From there, navigate to Home and you can right click to bring up the "Import" option.
The below image shows what the import dialog should look like if you're going to directly import a notebook from the MLflow documentation website:
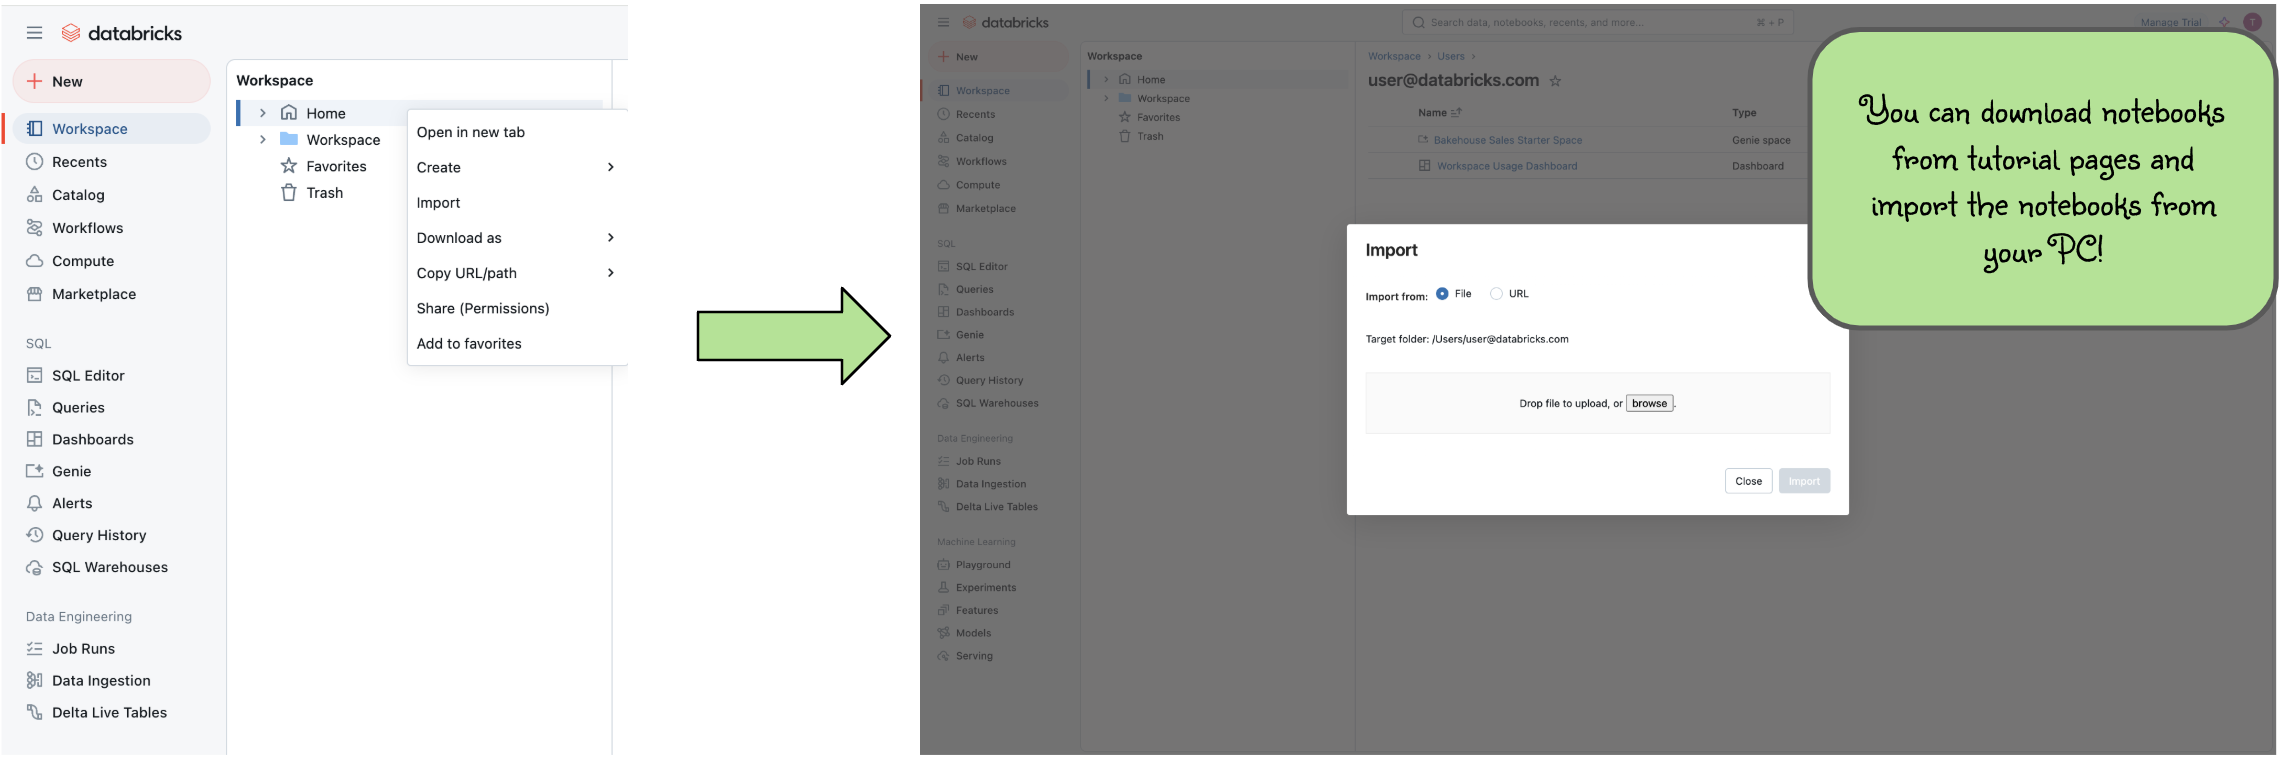
At this point, you can simply just run the tutorial.
Any calls to MLflow for creating experiments, initiating runs, logging metadata, and saving artifacts will be fully managed for you and your logging history will appear within the MLflow UI.
On Databricks platform, an MLflow experiment is automatically created for each notebook and you can skip mlflow.set_tracking_uri() and mlflow.set_experiment() calls in tutorials.
Running Notebooks locally and using Databricks Workspace as a remote tracking server
In order to stay within the comfortable confines of your local machine and still have the use of the managed MLflow Tracking Server, basically you need to:
- Generate a Personal Access Token (PAT)
- Set up Databricks workspace authentication in your dev environment.
- Connect to your Databricks Workspace in your MLflow experiment session.
Generate a PAT
If you are following along in the Tracing Tutorial, these steps are handled for you in both tutorials within the product. You can generate a remote access token directly within the tutorial.
Otherwise, follow the steps in this guide to create a PAT for remotely accessing your Databricks Workspace.
Install Dependencies
Run the following command in your dev environment to install dependencies.
%pip install -q mlflow
Set Up Authentication of Databricks Workspace
To set up Databricks Workspace authentication, we can use the API mlflow.login(), which will prompt you for required information:
- Databricks Host: Use "https://<your workspace host>.cloud.databricks.com/
- Token: Your personal access token for your Databricks Workspace.
If the authentication succeeds, you should see a message "Successfully signed in Databricks!".
import mlflow

mlflow.login()
2025/02/19 12:25:04 INFO mlflow.utils.credentials: No valid Databricks credentials found, please enter your credentials...
Databricks Host (should begin with https://):  https://<your workspace host>.cloud.databricks.com/
Token:  ········
2025/02/19 12:26:24 INFO mlflow.utils.credentials: Successfully connected to MLflow hosted tracking server! Host: https://<your workspace host>.cloud.databricks.com.
Connect MLflow Session to Databricks Workspace
We have set up the credentials, now we need to tell MLflow to send the data into Databricks Workspace.
To do so, we will use mlflow.set_tracking_uri("databricks") to port MLflow to Databricks Workspace. Basically
it is the command below. Please note that you need to always use "databricks" as the keyword.
mlflow.set_tracking_uri("databricks")
Now you are ready to go! Let's try starting an MLflow experiment and log some dummy metrics and view it in the UI.
Firstly, you need to create a Unity Catalog Volume test.mlflow.check-databricks-connection by following this guide.
Then, you can run the following codes to start an experiment with the Unity Catalog Volume and log metrics to it.
Note that your experiment name must follow the /Users/<your email>/<experiment_name> format when using a Databricks Workspace.
mlflow.create_experiment(
    "/Users/<your email>/check-databricks-connection",
    artifact_location="dbfs:/Volumes/test/mlflow/check-databricks-connection",
)
mlflow.set_experiment("/Users/<your email>/check-databricks-connection")

with mlflow.start_run():
    mlflow.log_metric("foo", 1)
    mlflow.log_metric("bar", 2)
2025/02/19 12:26:33 INFO mlflow.tracking.fluent: Experiment with name '/Users/<your email>/check-databricks-connection' does not exist. Creating a new experiment.
View Your Experiment on your Databricks Workspace
Now let's navigate to your Databricks Workspace to view the experiment result. Log in to your Databricks Workspace, and click on top left to select machine learning in the drop down list. Then click on the experiment icon. See the screenshot below:
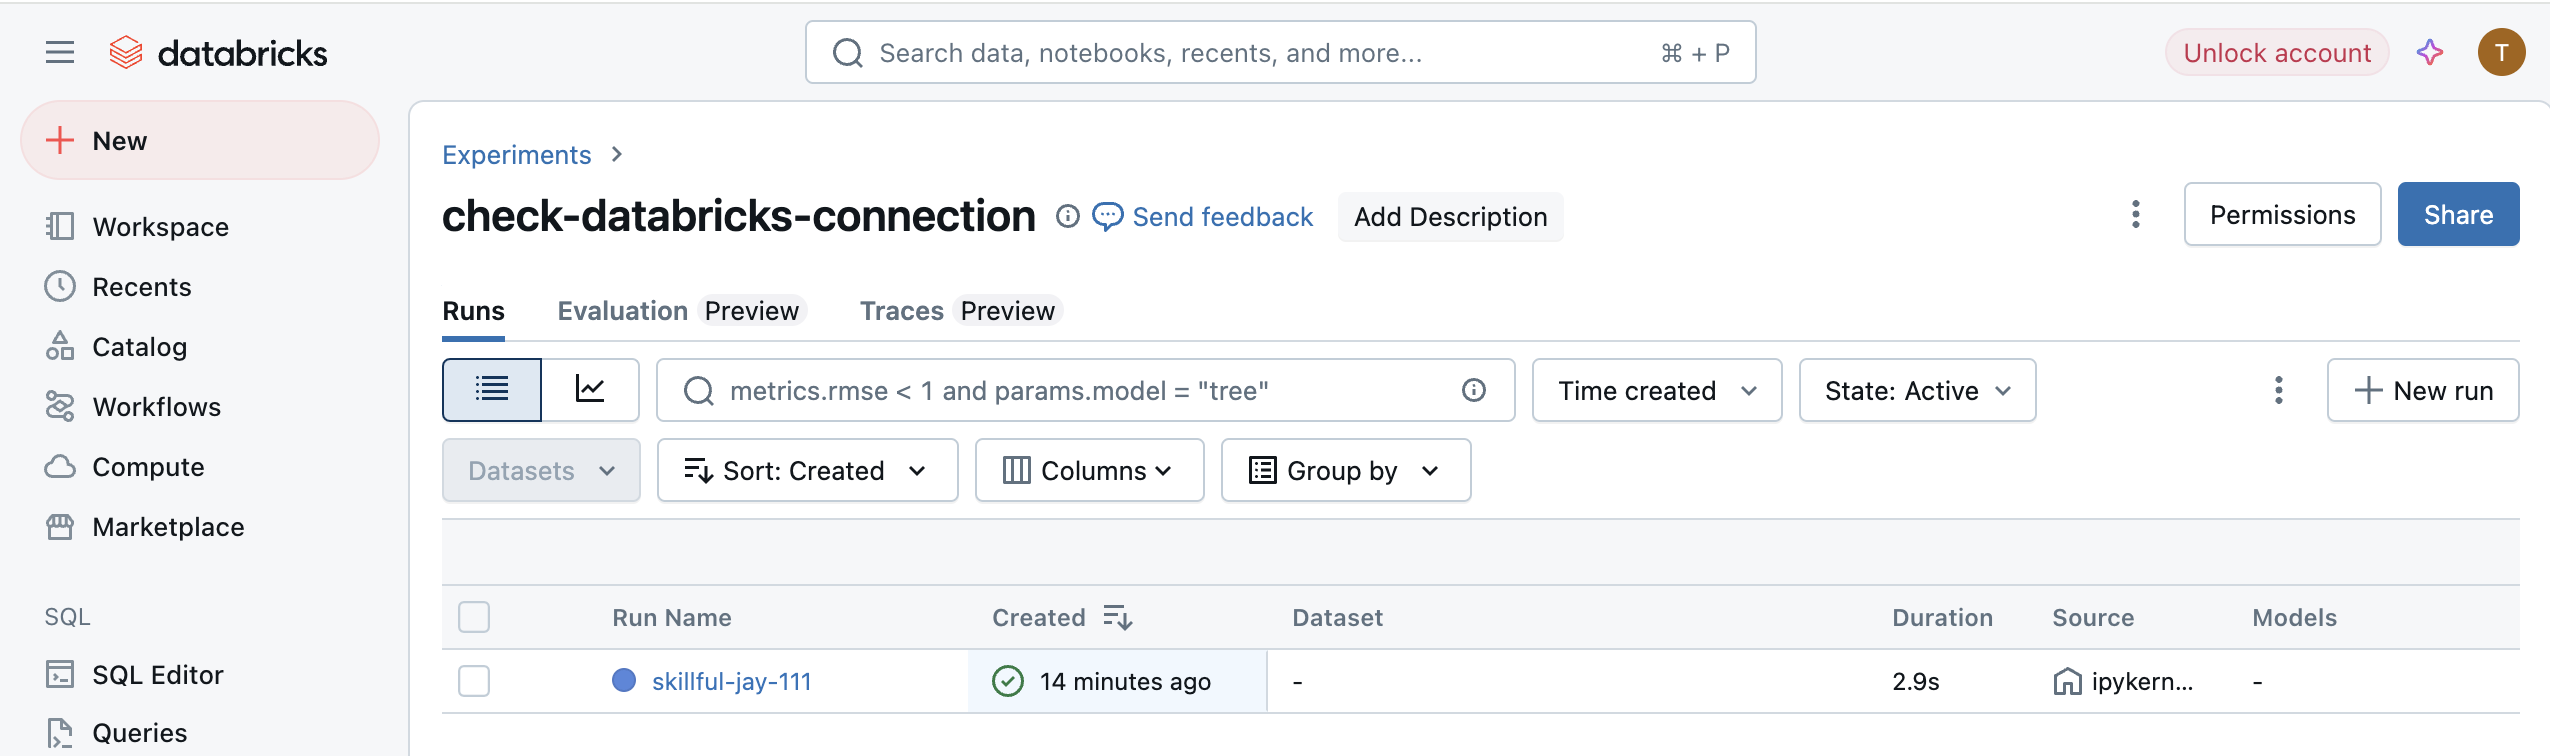
In the "Experiments" view, you should be able to find the experiment "check-databricks-connection", similar to
Clicking on the run name, in our example it is "skillful-jay-111" (it's a randomly generated name, you will see a different name in your Databricks console), will bring you to the run view, similar to
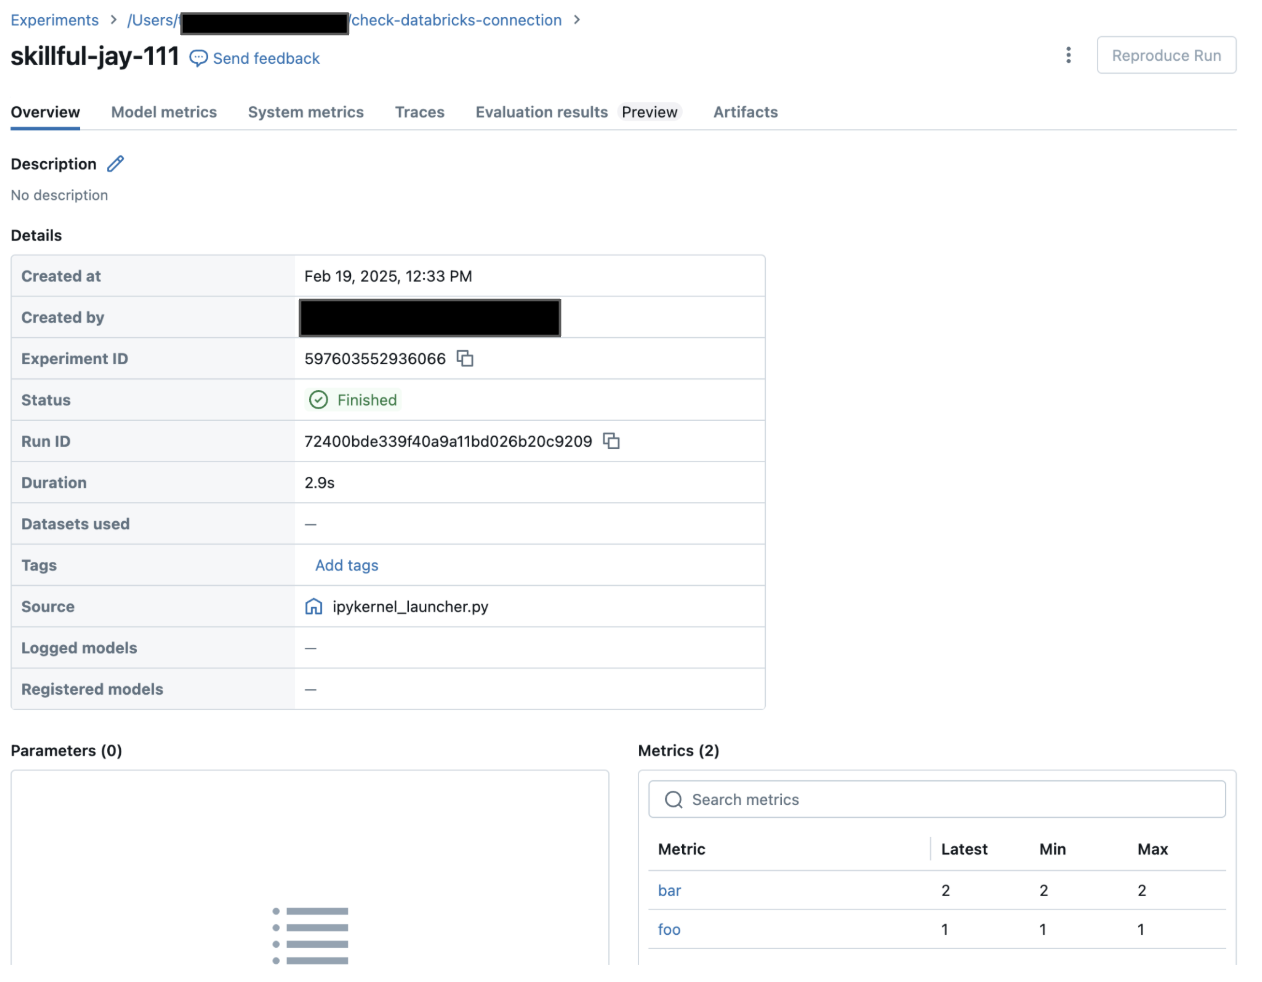
In the run view, you will see your dummy metrics "foo" and "bar" are logged successfully.
At this point, you're ready to go! You can run any of the tutorials locally and they will log to the managed MLflow Tracking Server.