GenAI Agent with MLflow 3.0
Prerequisites
Run the following command to install MLflow 3.0 and langchain-openai packages.
pip install --upgrade 'mlflow>=3.0.0rc0' --pre
pip install langchain-openai
Set OPENAI_API_KEY environment variable in CLI to authenticate to OpenAI APIs.
export OPENAI_API_KEY=your_api_key_here
This example demonstrates how to use MLflow to trace and evaluate langchain model requests with prompt engineering. It showcases how to register prompts, generate traces, and assess response performance using evaluation datasets. The example also highlights the ability to track interactive traces and link them to the logged model for better observability.
Register a prompt template
First, we register a prompt template as a prompt version in MLflow. This allows us to track and manage different versions of the prompt used during development, ensuring reproducibility and better observability.
import mlflow

system_prompt = mlflow.register_prompt(
    name="chatbot_prompt",
    template="You are a chatbot that can answer questions about IT. Answer this question: {{question}}",
    commit_message="Initial version of chatbot",
)
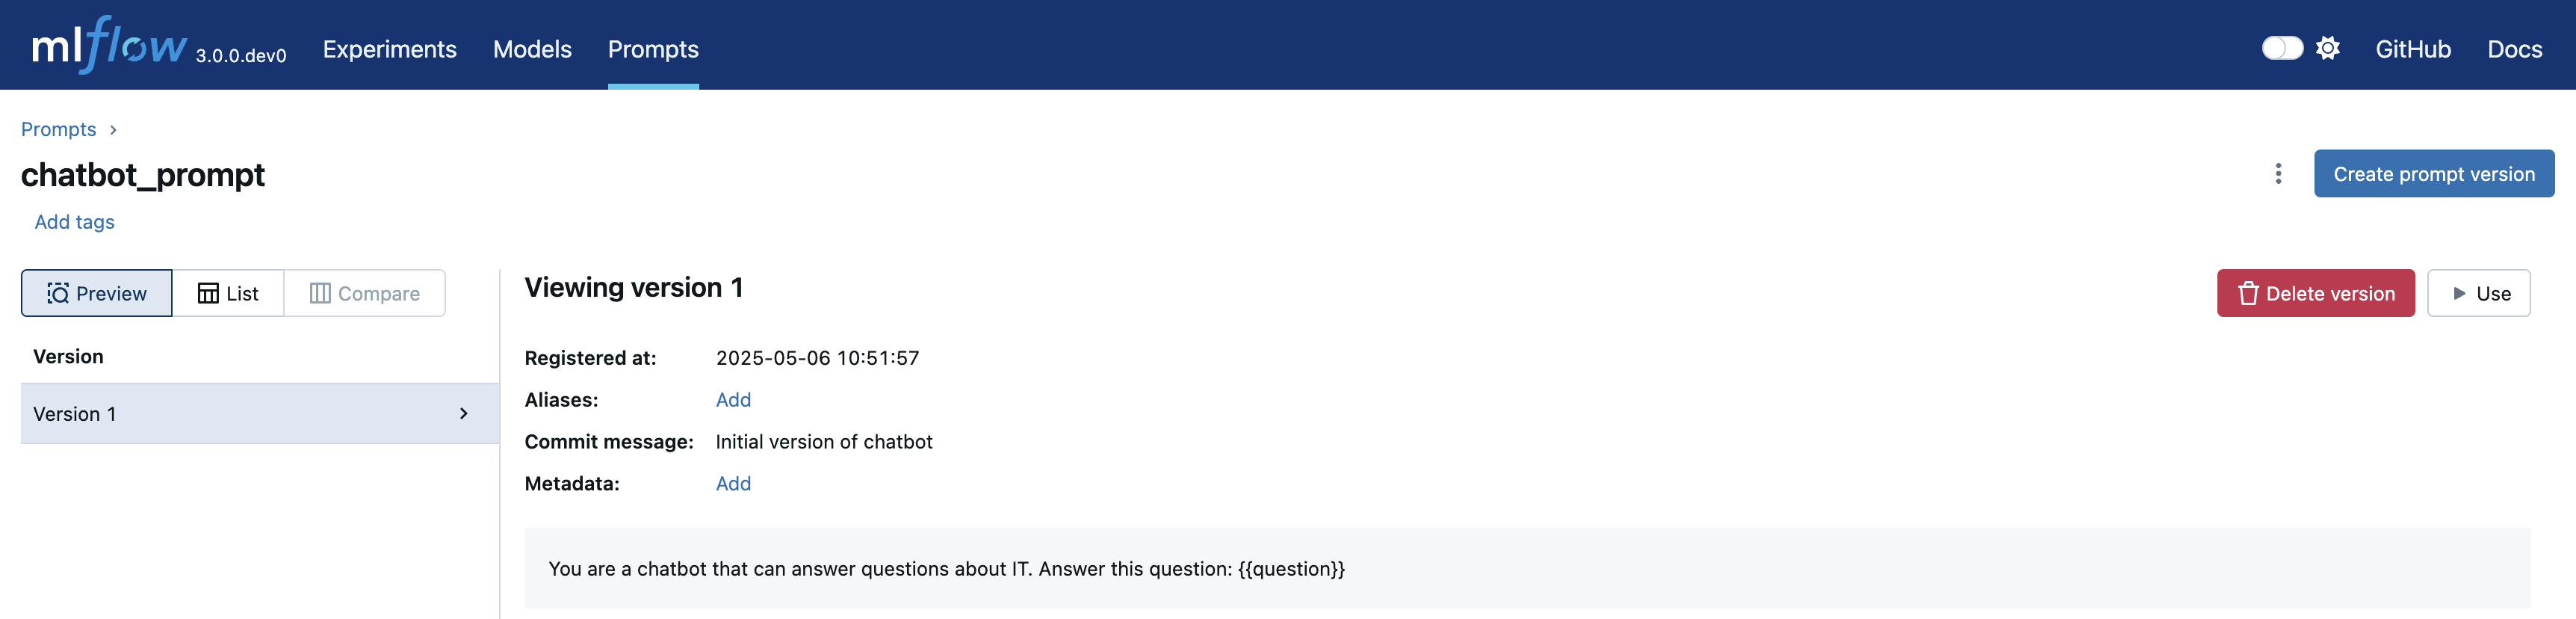
Switch to the Prompts tab to view the registered prompt and its details:
Create a chain with Langchain
Next, we use ChatPromptTemplate with the prompt registered in the previous step and combine it with ChatOpenAI to create a simple chain that answers user questions.
from langchain.schema.output_parser import StrOutputParser
from langchain_core.prompts import ChatPromptTemplate
from langchain_openai import ChatOpenAI

prompt = ChatPromptTemplate.from_template(system_prompt.to_single_brace_format())
chain = prompt | ChatOpenAI(temperature=0.7) | StrOutputParser()
question = "What is MLflow?"
print(chain.invoke({"question": question}))
# MLflow is an open-source platform for managing the end-to-end machine learning lifecycle...
Test the model with tracing observability
In this section, we manually test the model with example queries and leverage MLflow Tracing to analyze the outputs and debug potential issues.
As part of setup, set an active model with mlflow.set_active_model() API to enable linking any traces generated during app development to it.
With autologging enabled, all generated traces will be linked to the current active model, ensuring seamless observability.
# set the active model for linking traces
mlflow.set_active_model(name="langchain_model")

# Enable autologging so that interactive traces from the client are automatically linked to a LoggedModel
mlflow.langchain.autolog()

questions = [
    "What is MLflow Tracking and how does it work?",
    "What is Unity Catalog?",
    "What are user-defined functions (UDFs)?",
]
outputs = []

for question in questions:
    outputs.append(chain.invoke({"question": question}))

# fetch the current active model's id and check traces
active_model_id = mlflow.get_active_model_id()
mlflow.search_traces(model_id=active_model_id)
#                            trace_id                                             trace  ...  assessments                        request_id
# 0  e807ab0a020f4794989a24c84c2892ad  Trace(trace_id=e807ab0a020f4794989a24c84c2892ad)  ...           []  e807ab0a020f4794989a24c84c2892ad
# 1  4eb83e4adb6a4f3494bc5b33aca4e970  Trace(trace_id=4eb83e4adb6a4f3494bc5b33aca4e970)  ...           []  4eb83e4adb6a4f3494bc5b33aca4e970
# 2  42b100851f934c969c352930f699308d  Trace(trace_id=42b100851f934c969c352930f699308d)  ...           []  42b100851f934c969c352930f699308d
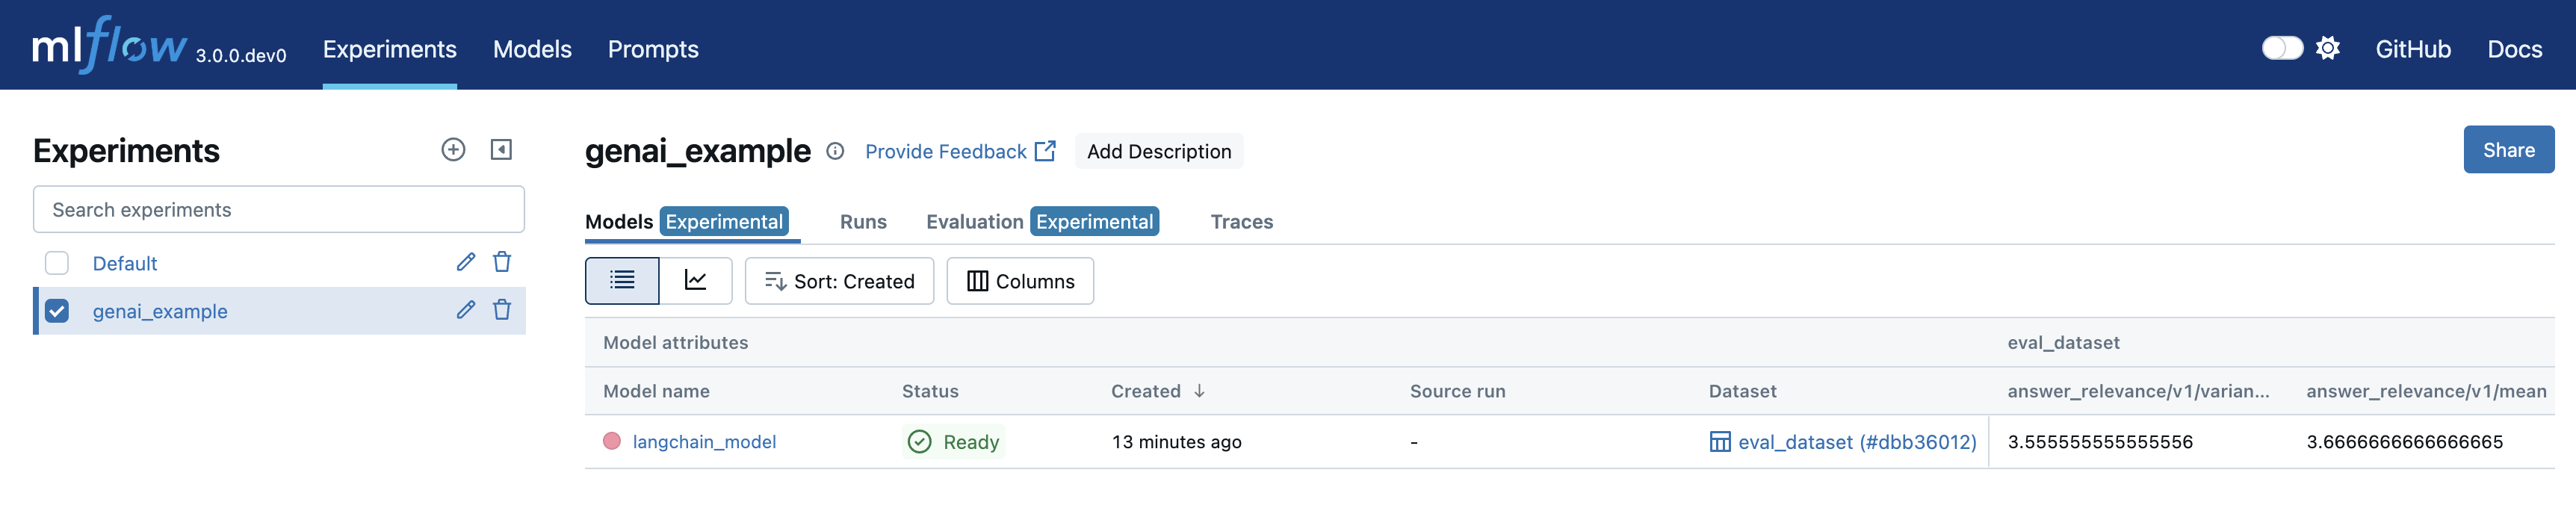
Check out the Models tab in the experiment to view the new logged model with name langchain_model.
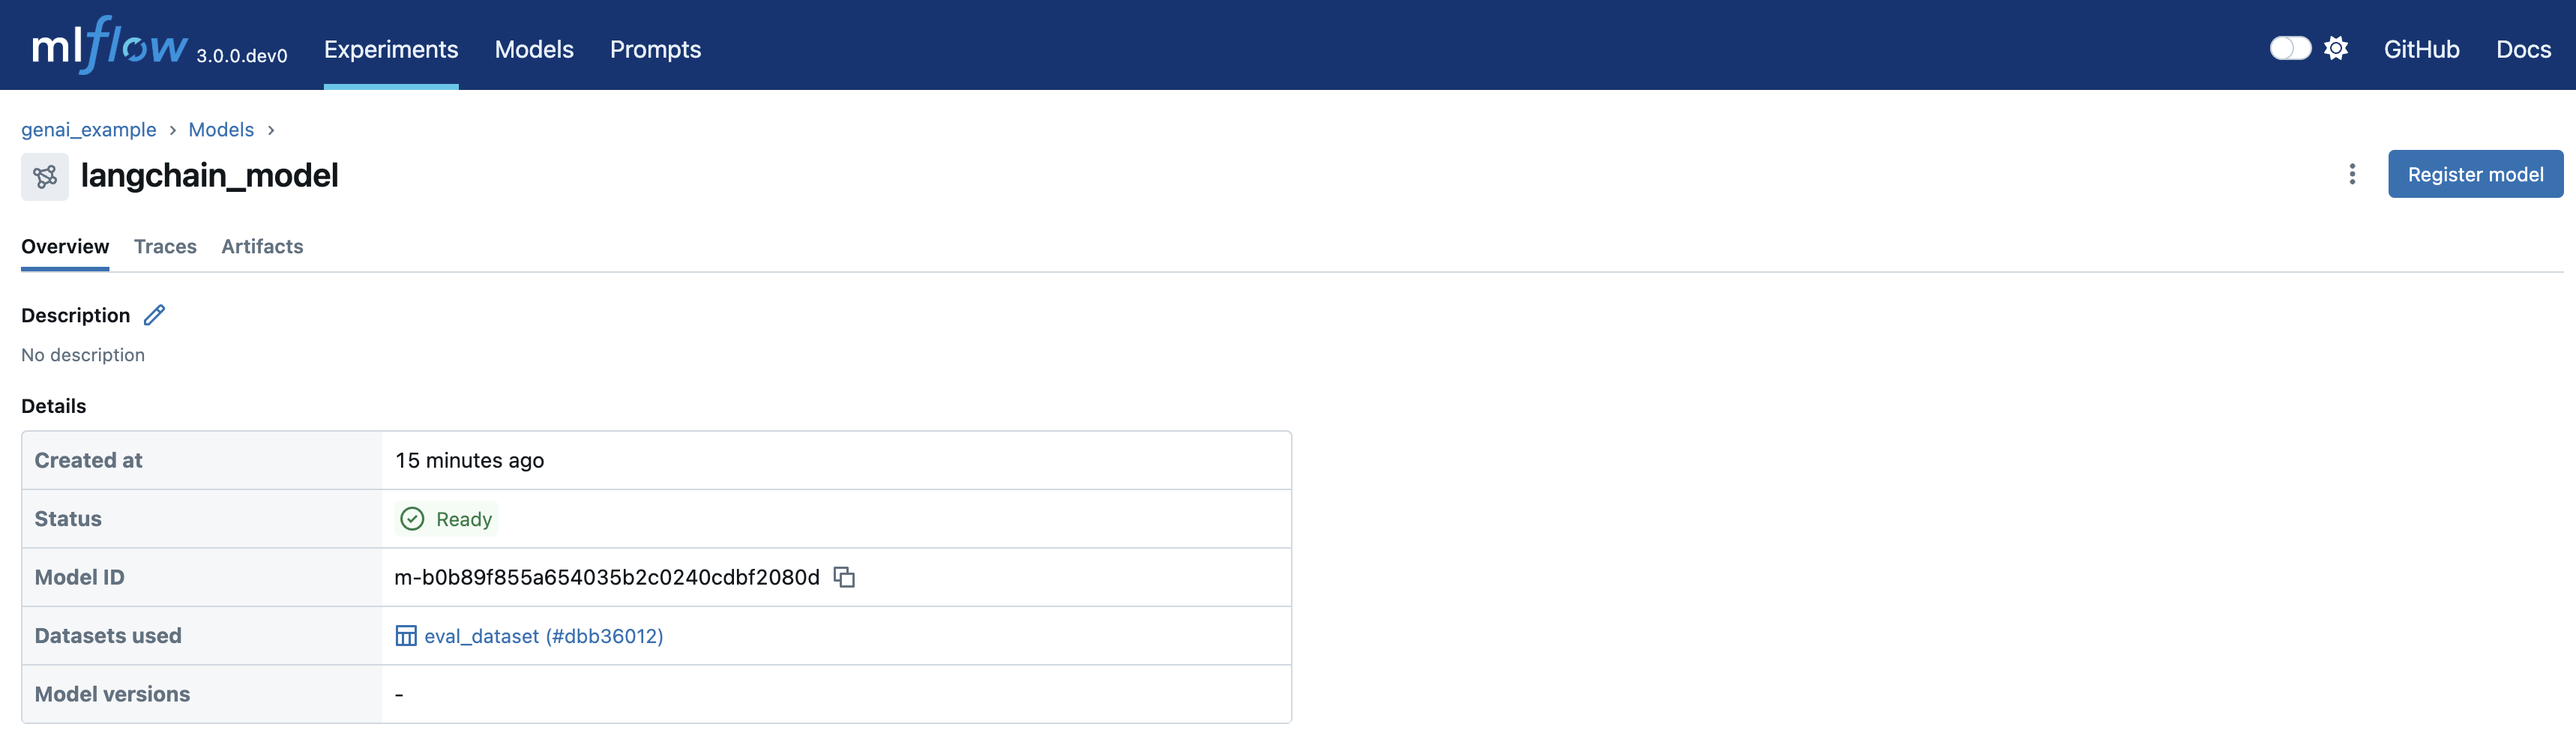
On the Logged Model page, you can view detailed information, including the model_id.
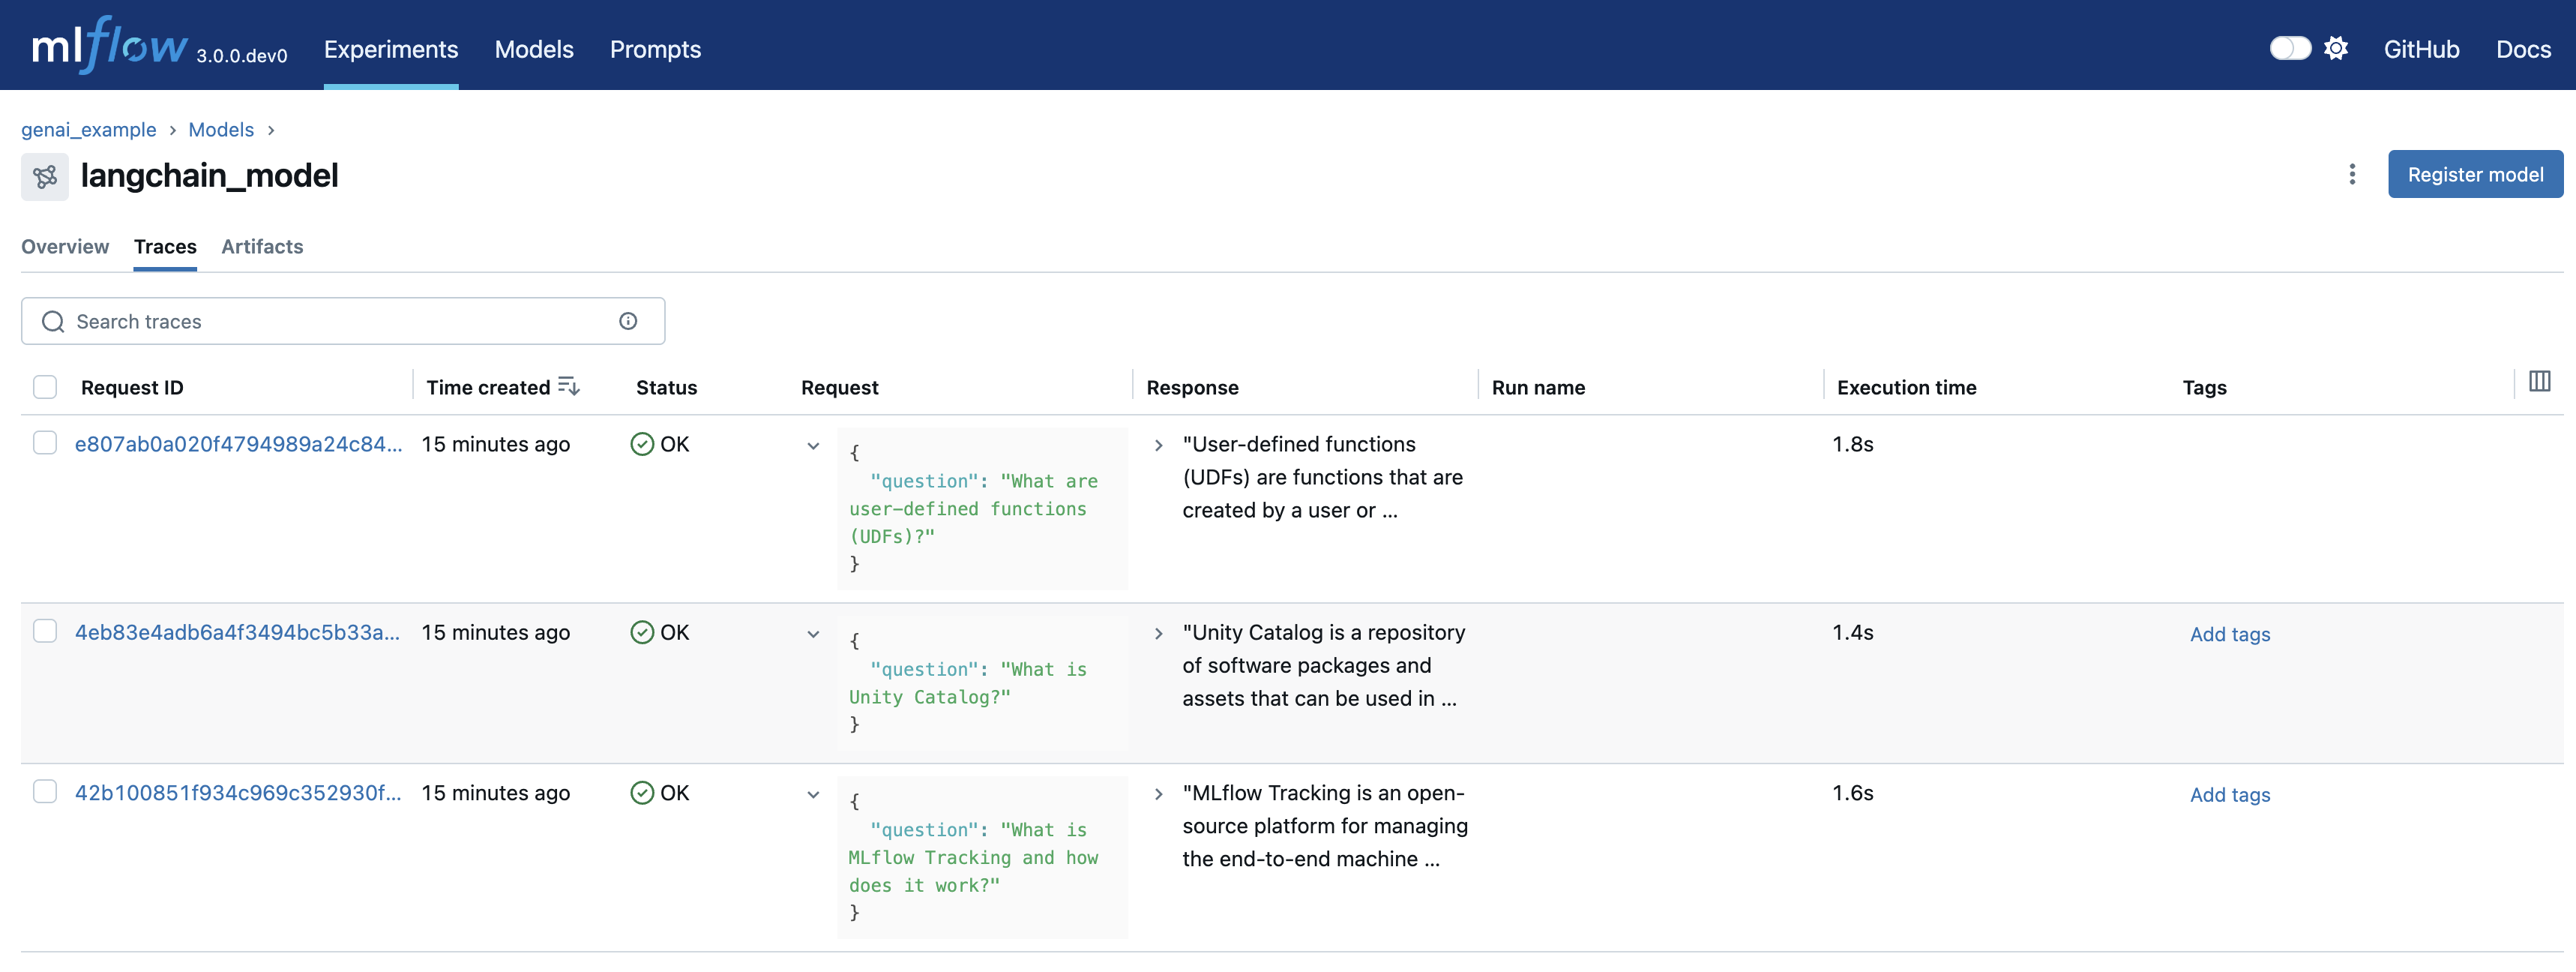
Navigating to the Traces tab of the model's page, you can view the traces that were just generated.
Evaluate the agent's performance
Finally, we use mlflow.evaluate() to assess the performance of the chain on an evaluation dataset.
This step involves calculating additional metrics, such as answer correctness, to gain deeper insights into the model's behavior and accuracy.
# Prepare the eval dataset in a pandas DataFrame
import pandas as pd

eval_df = pd.DataFrame(
    {
        "messages": questions,
        "expected_response": [
            """MLflow Tracking is a key component of the MLflow platform designed to record and manage machine learning experiments. It enables data scientists and engineers to log parameters, code versions, metrics, and artifacts in a systematic way, facilitating experiment tracking and reproducibility.\n\nHow It Works:\n\nAt the heart of MLflow Tracking is the concept of a run, which is an execution of a machine learning code. Each run can log the following:\n\nParameters: Input variables or hyperparameters used in the model (e.g., learning rate, number of trees). Metrics: Quantitative measures to evaluate the model's performance (e.g., accuracy, loss). Artifacts: Output files like models, datasets, or images generated during the run. Source Code: The version of the code or Git commit hash used. These logs are stored in a tracking server, which can be set up locally or on a remote server. The tracking server uses a backend storage (like a database or file system) to keep a record of all runs and their associated data.\n\n Users interact with MLflow Tracking through its APIs available in multiple languages (Python, R, Java, etc.). By invoking these APIs in the code, you can start and end runs, and log data as the experiment progresses. Additionally, MLflow offers autologging capabilities for popular machine learning libraries, automatically capturing relevant parameters and metrics without manual code changes.\n\nThe logged data can be visualized using the MLflow UI, a web-based interface that displays all experiments and runs. This UI allows you to compare runs side-by-side, filter results, and analyze performance metrics over time. It aids in identifying the best models and understanding the impact of different parameters.\n\nBy providing a structured way to record experiments, MLflow Tracking enhances collaboration among team members, ensures transparency, and makes it easier to reproduce results. It integrates seamlessly with other MLflow components like Projects and Model Registry, offering a comprehensive solution for managing the machine learning lifecycle.""",
            """Unity Catalog is a feature in Databricks that allows you to create a centralized inventory of your data assets, such as tables, views, and functions, and share them across different teams and projects. It enables easy discovery, collaboration, and reuse of data assets within your organization.\n\nWith Unity Catalog, you can:\n\n1. Create a single source of truth for your data assets: Unity Catalog acts as a central repository of all your data assets, making it easier to find and access the data you need.\n2. Improve collaboration: By providing a shared inventory of data assets, Unity Catalog enables data scientists, engineers, and other stakeholders to collaborate more effectively.\n3. Foster reuse of data assets: Unity Catalog encourages the reuse of existing data assets, reducing the need to create new assets from scratch and improving overall efficiency.\n4. Enhance data governance: Unity Catalog provides a clear view of data assets, enabling better data governance and compliance.\n\nUnity Catalog is particularly useful in large organizations where data is scattered across different teams, projects, and environments. It helps create a unified view of data assets, making it easier to work with data across different teams and projects.""",
            """User-defined functions (UDFs) in the context of Databricks and Apache Spark are custom functions that you can create to perform specific tasks on your data. These functions are written in a programming language such as Python, Java, Scala, or SQL, and can be used to extend the built-in functionality of Spark.\n\nUDFs can be used to perform complex data transformations, data cleaning, or to apply custom business logic to your data. Once defined, UDFs can be invoked in SQL queries or in DataFrame transformations, allowing you to reuse your custom logic across multiple queries and applications.\n\nTo use UDFs in Databricks, you first need to define them in a supported programming language, and then register them with the SparkSession. Once registered, UDFs can be used in SQL queries or DataFrame transformations like any other built-in function.\n\nHere\'s an example of how to define and register a UDF in Python:\n\n```python\nfrom pyspark.sql.functions import udf\nfrom pyspark.sql.types import IntegerType\n\n# Define the UDF function\ndef multiply_by_two(value):\n    return value * 2\n\n# Register the UDF with the SparkSession\nmultiply_udf = udf(multiply_by_two, IntegerType())\n\n# Use the UDF in a DataFrame transformation\ndata = spark.range(10)\nresult = data.withColumn("multiplied", multiply_udf(data.id))\nresult.show()\n```\n\nIn this example, we define a UDF called `multiply_by_two` that multiplies a given value by two. We then register this UDF with the SparkSession using the `udf` function, and use it in a DataFrame transformation to multiply the `id` column of a DataFrame by two.""",
        ],
        "predictions": outputs,
    }
)

# Start a run to represent the evaluation job
with mlflow.start_run() as evaluation_run:
    eval_dataset = mlflow.data.from_pandas(
        df=eval_df,
        name="eval_dataset",
        targets="expected_response",
        predictions="predictions",
    )
    mlflow.log_input(dataset=eval_dataset)
    # Run the evaluation based on extra metrics
    # Current active model will be automatically used
    result = mlflow.evaluate(
        data=eval_dataset,
        extra_metrics=[
            mlflow.metrics.genai.answer_correctness("openai:/gpt-4o"),
            mlflow.metrics.genai.answer_relevance("openai:/gpt-4o"),
        ],
        # This is needed since answer_correctness looks for 'inputs' field
        evaluator_config={"col_mapping": {"inputs": "messages"}},
    )

result.tables["eval_results_table"]
#                                         messages  ...                  answer_relevance/v1/justification
# 0  What is MLflow Tracking and how does it work?  ...  The output directly addresses the input questi...
# 1                         What is Unity Catalog?  ...  The output is completely irrelevant to the inp...
# 2        What are user-defined functions (UDFs)?  ...  The output directly addresses the input questi...
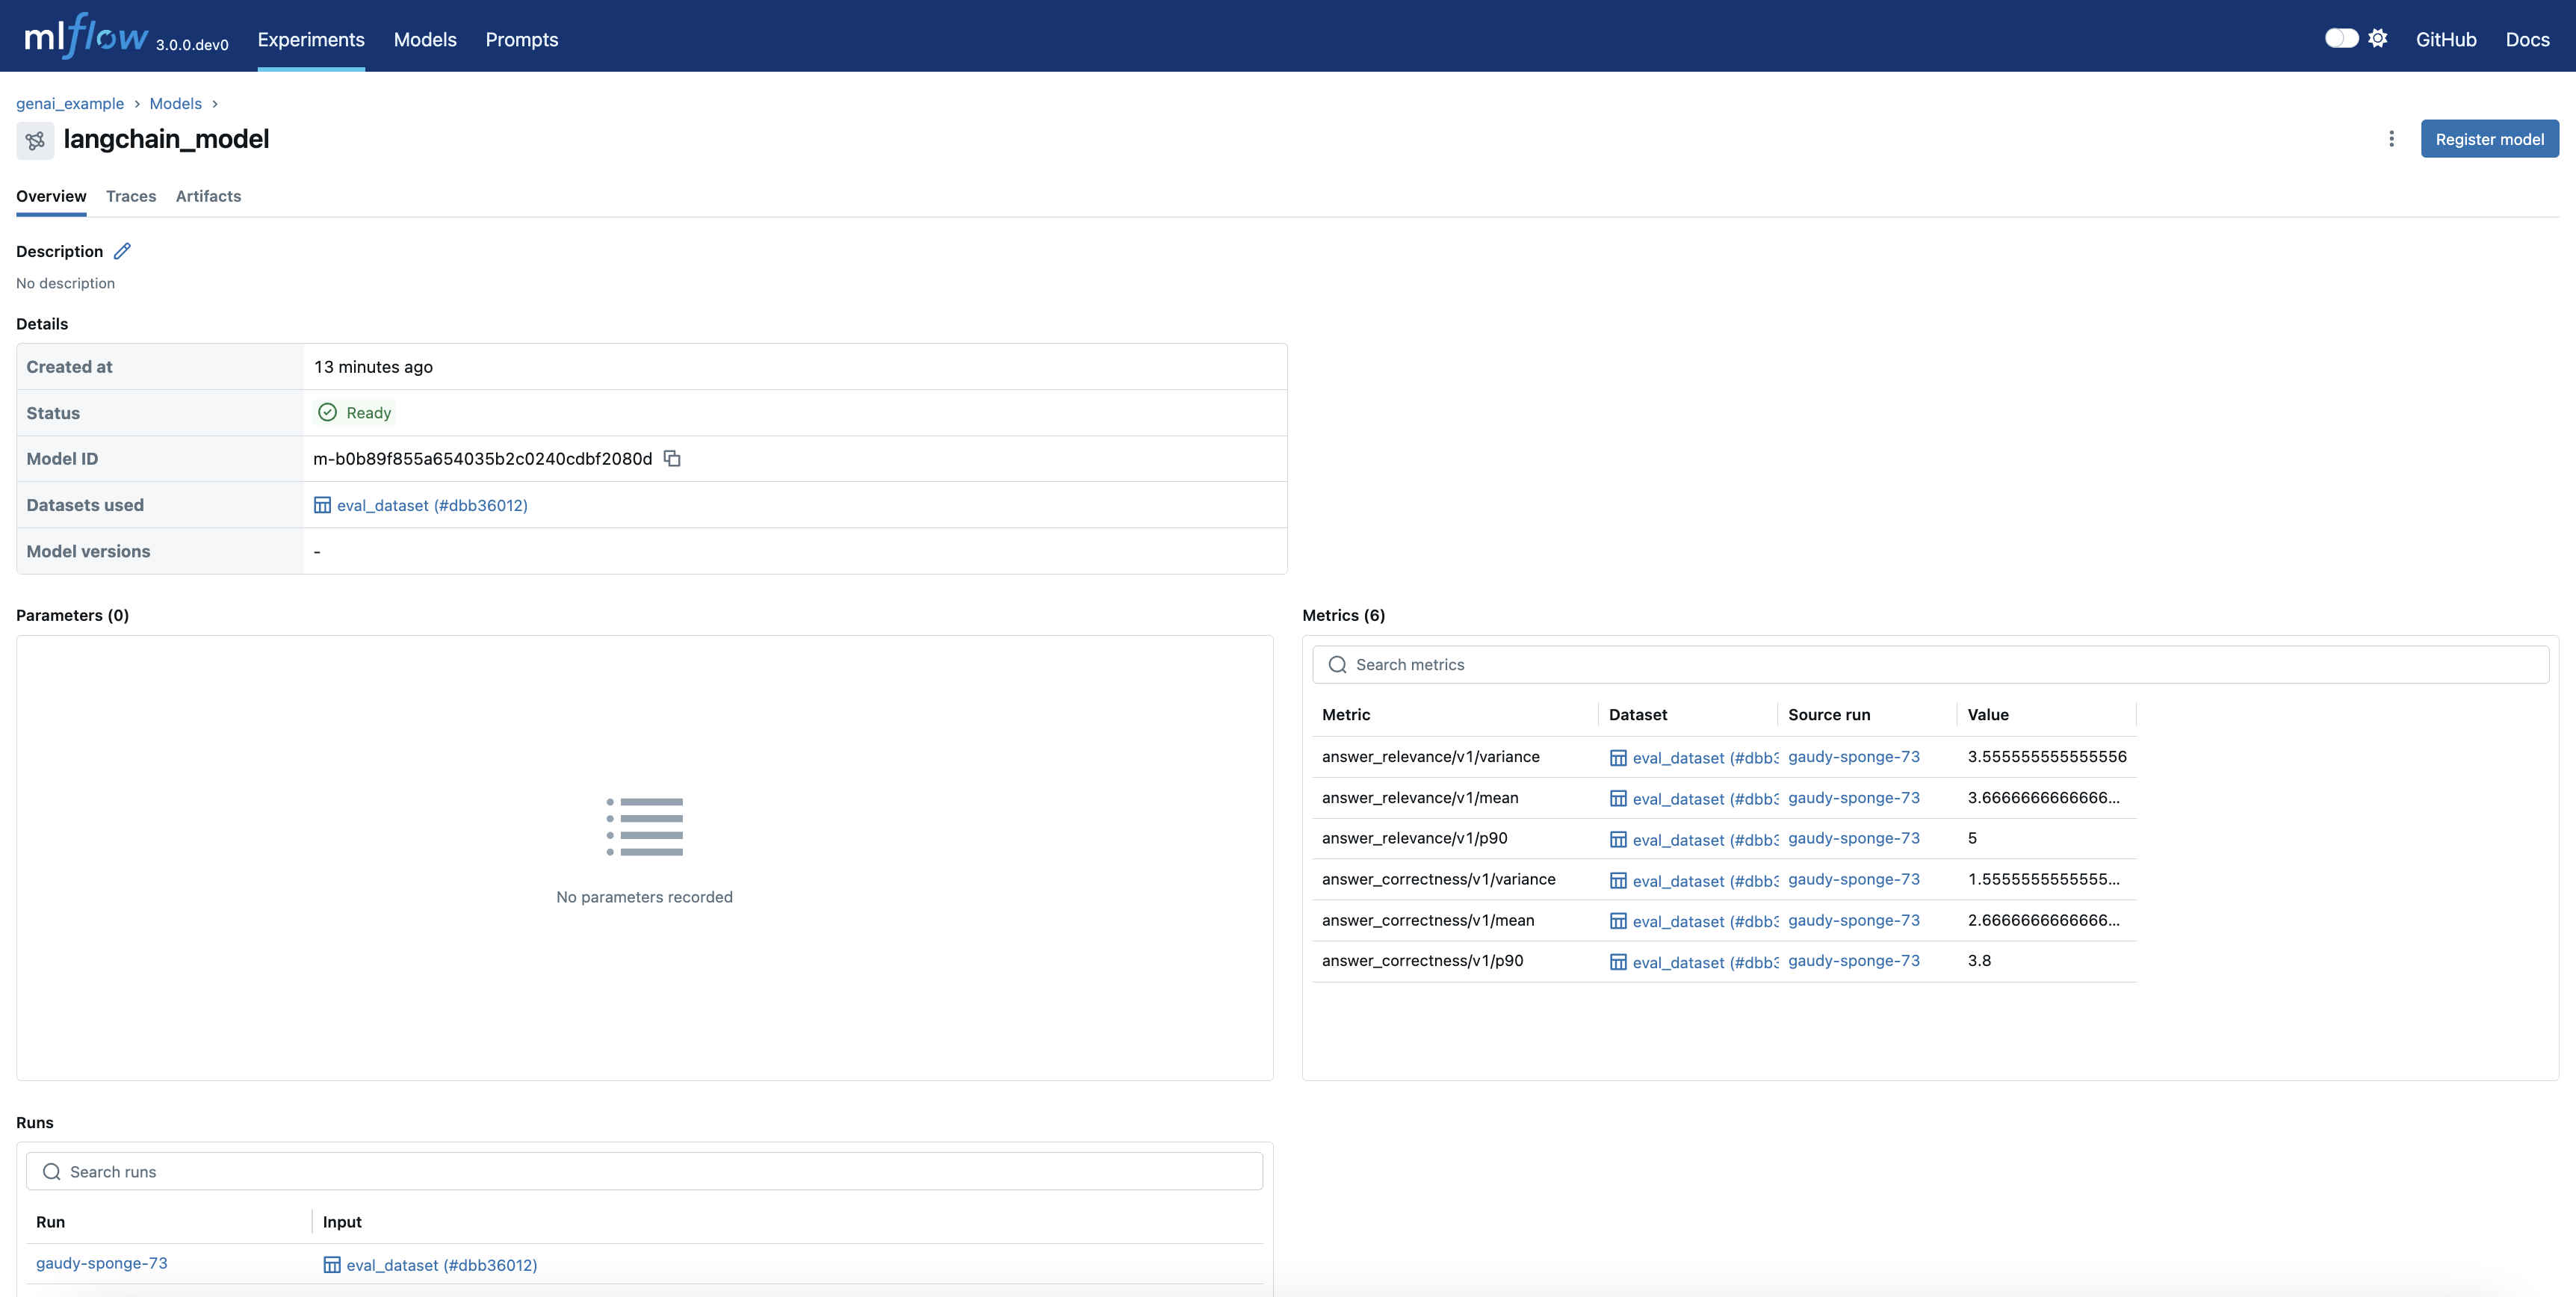
Navigating to the active model, you can see the metrics and their details displayed in the MLflow UI. This includes metrics like answer correctness and answer relevance, providing insights into the model's performance.