Manual Tracing
While MLflow's automatic tracing provides instant observability for supported frameworks, manual tracing gives you complete control over how your GenAI applications are instrumented. This flexibility is essential for building production-ready applications that require detailed monitoring and debugging capabilities.
Manual tracing is the right choice when you need:
- 🔍 Fine-Grained Control: Define exactly which parts of your code to trace
- ⚙️ Custom Frameworks: Instrument proprietary or internal frameworks
- 🤖 Advanced Scenarios: Complex workflows, multi-threaded or async operations, streaming responses with custom aggregation, custom trace metadata and attributes
Manual Tracing Examples
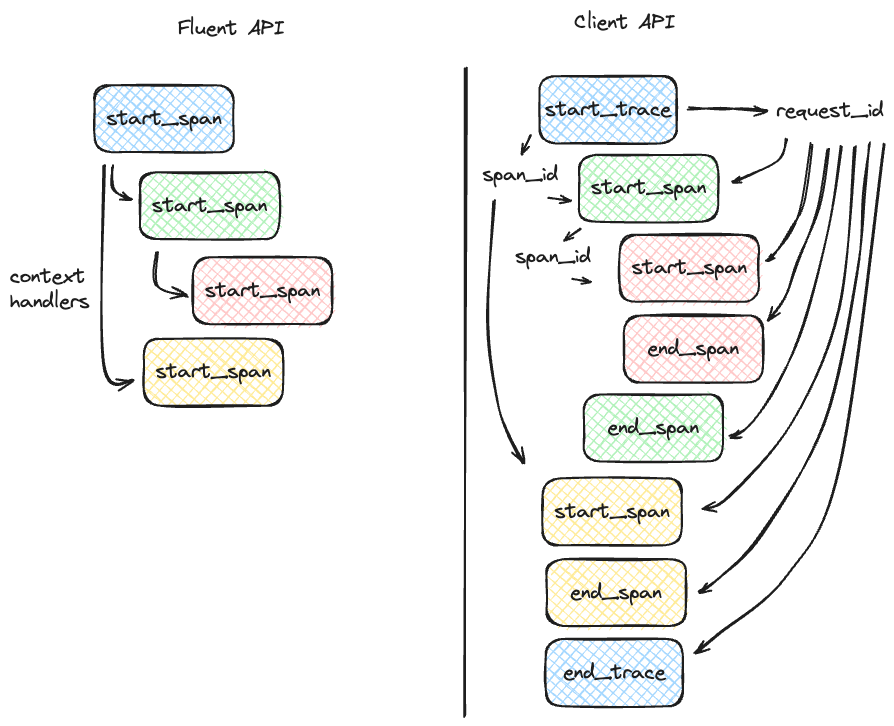
The manual tracing APIs provide an intuitive way to add tracing with minimal code changes. They automatically handle trace lifecycle, exception tracking, and parent-child relationships.
- Decorator
- Context Manager
Best for: Function-level tracing with minimal code changes
import mlflow
from mlflow.entities import SpanType


@mlflow.trace(span_type=SpanType.CHAIN)
def process_request(query: str) -> str:
    # Your code here - automatically traced!
    result = generate_response(query)
    return result


@mlflow.trace(span_type=SpanType.LLM)
def generate_response(query: str) -> str:
    # Nested function - parent-child relationship handled automatically
    return llm.invoke(query)
Key Benefits:
- One-line instrumentation for any function
- Automatic exception handling
- Works with async/generator functions
Best for: Tracing code blocks and complex workflows
import mlflow

with mlflow.start_span(name="data_processing") as span:
    # Set inputs at the start
    span.set_inputs({"query": query, "filters": filters})

    # Your processing logic
    data = fetch_data(query, filters)
    processed = transform_data(data)

    # Set outputs before exiting
    span.set_outputs({"count": len(processed), "status": "success"})
Key Benefits:
- Flexible span boundaries
- Custom input/output setting
- Ideal for non-function code blocks
Next Steps
Ready to start instrumenting your code? Choose your approach:
Decorators & Fluent APIs - Start here for most use cases
Automatic Tracing - Combine manual and automatic tracing