Tracing Concepts
This guide introduces the core concepts of tracing and observability for GenAI applications. If you're new to tracing, this conceptual overview will help you understand the fundamental building blocks before diving into implementation.
What is Tracing?
Tracing is an observability technique that captures the complete execution flow of a request through your application. Unlike traditional logging that captures discrete events, tracing creates a detailed map of how data flows through your system, recording every operation, transformation, and decision point.
In the context of GenAI applications, tracing becomes essential because these systems involve complex, multi-step workflows that are difficult to debug and optimize without complete visibility into their execution.
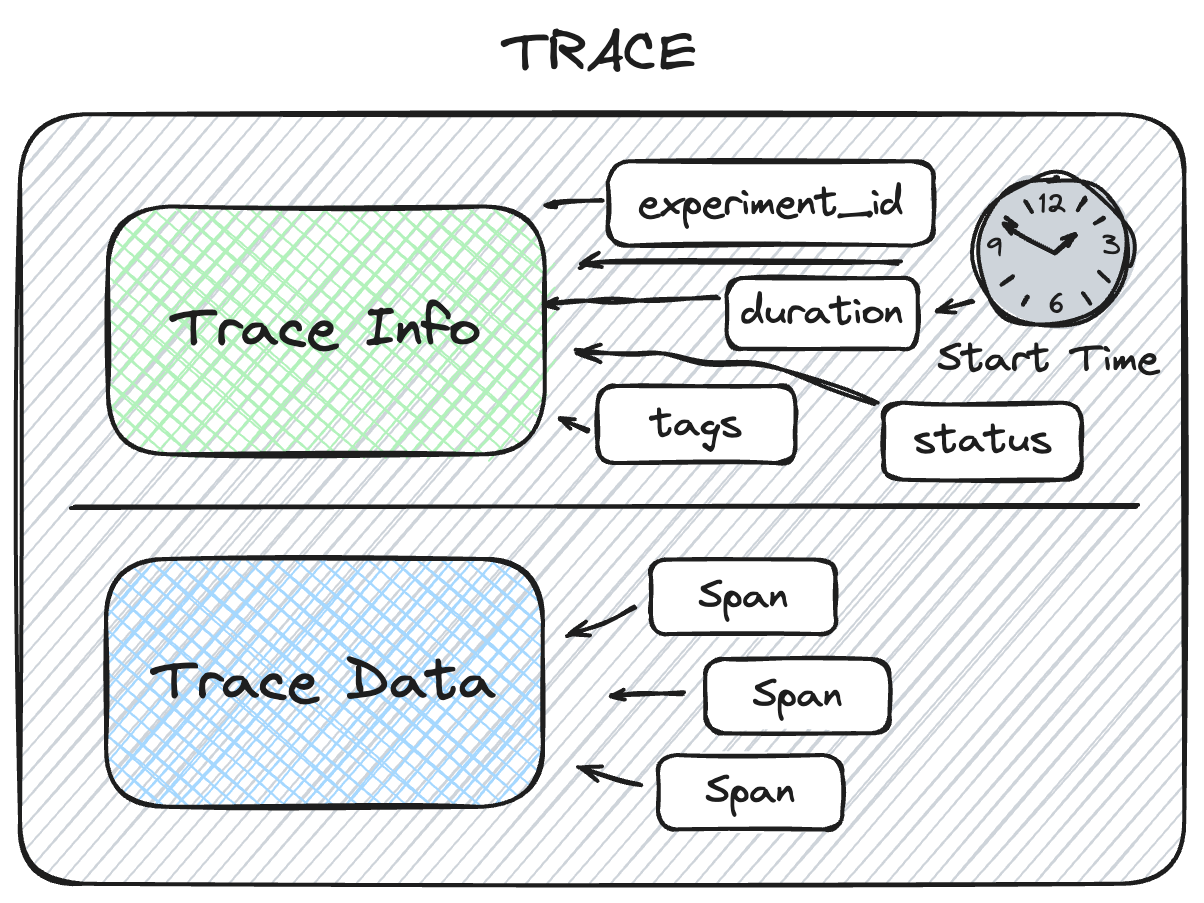
Core Architecture: Trace = TraceInfo + TraceData
MLflow traces follow a simple but powerful structure: Trace = TraceInfo + TraceData where TraceData = List[Span]
- Complete Trace Structure
- TraceInfo: The Metadata
- TraceData: The Execution Details
- Span: Individual Operations
A Trace in MLflow consists of two main components:
TraceInfo: Metadata about the overall trace (timing, status, preview data)
TraceData: The core execution data containing all the individual spans
This separation allows for efficient querying and filtering of traces while maintaining detailed execution information.
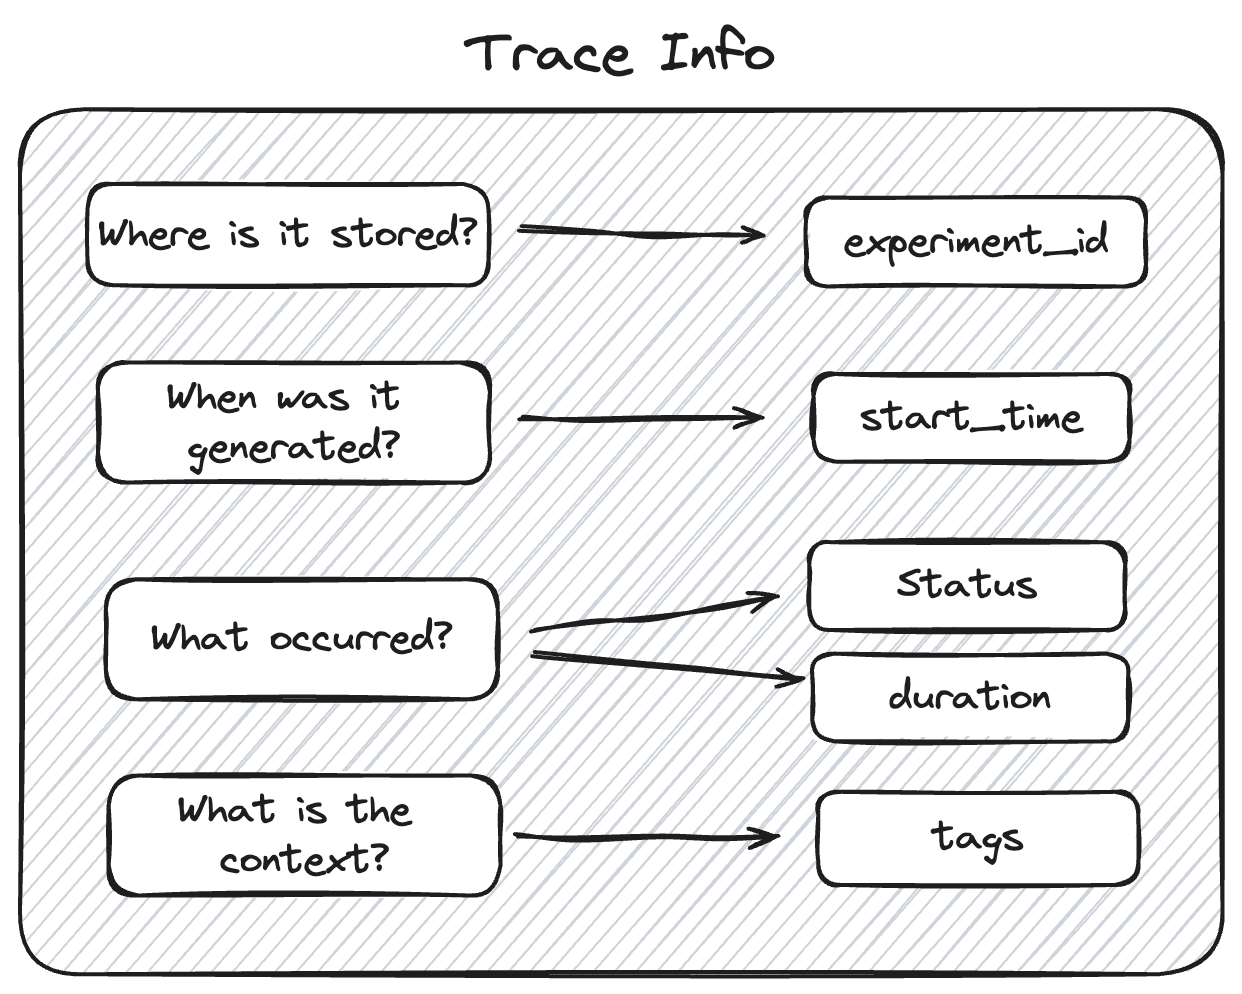
TraceInfo provides a lightweight snapshot of critical data about the overall trace, including:
Identification: Unique trace ID and storage location
Timing: Start time and total execution duration
Status: Success, failure, or in-progress state
Previews: Summary of request and response data
Organization: Tags and metadata for searching and filtering
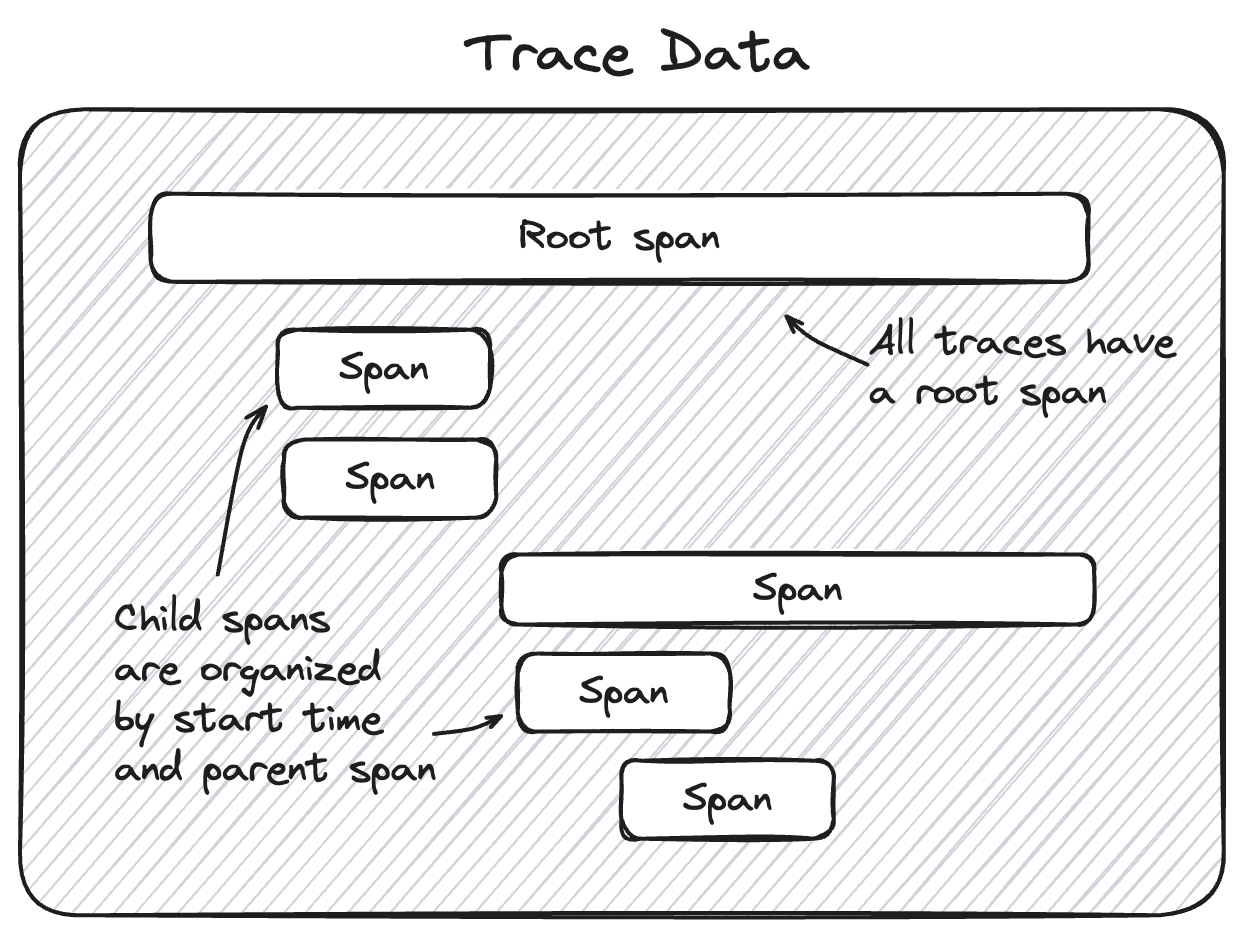
TraceData contains the core execution information as a list of Span objects. These spans are organized in a hierarchical relationship that shows the complete flow of operations in your application.
Each span represents a single operation and includes detailed information about inputs, outputs, timing, and any errors that occurred.
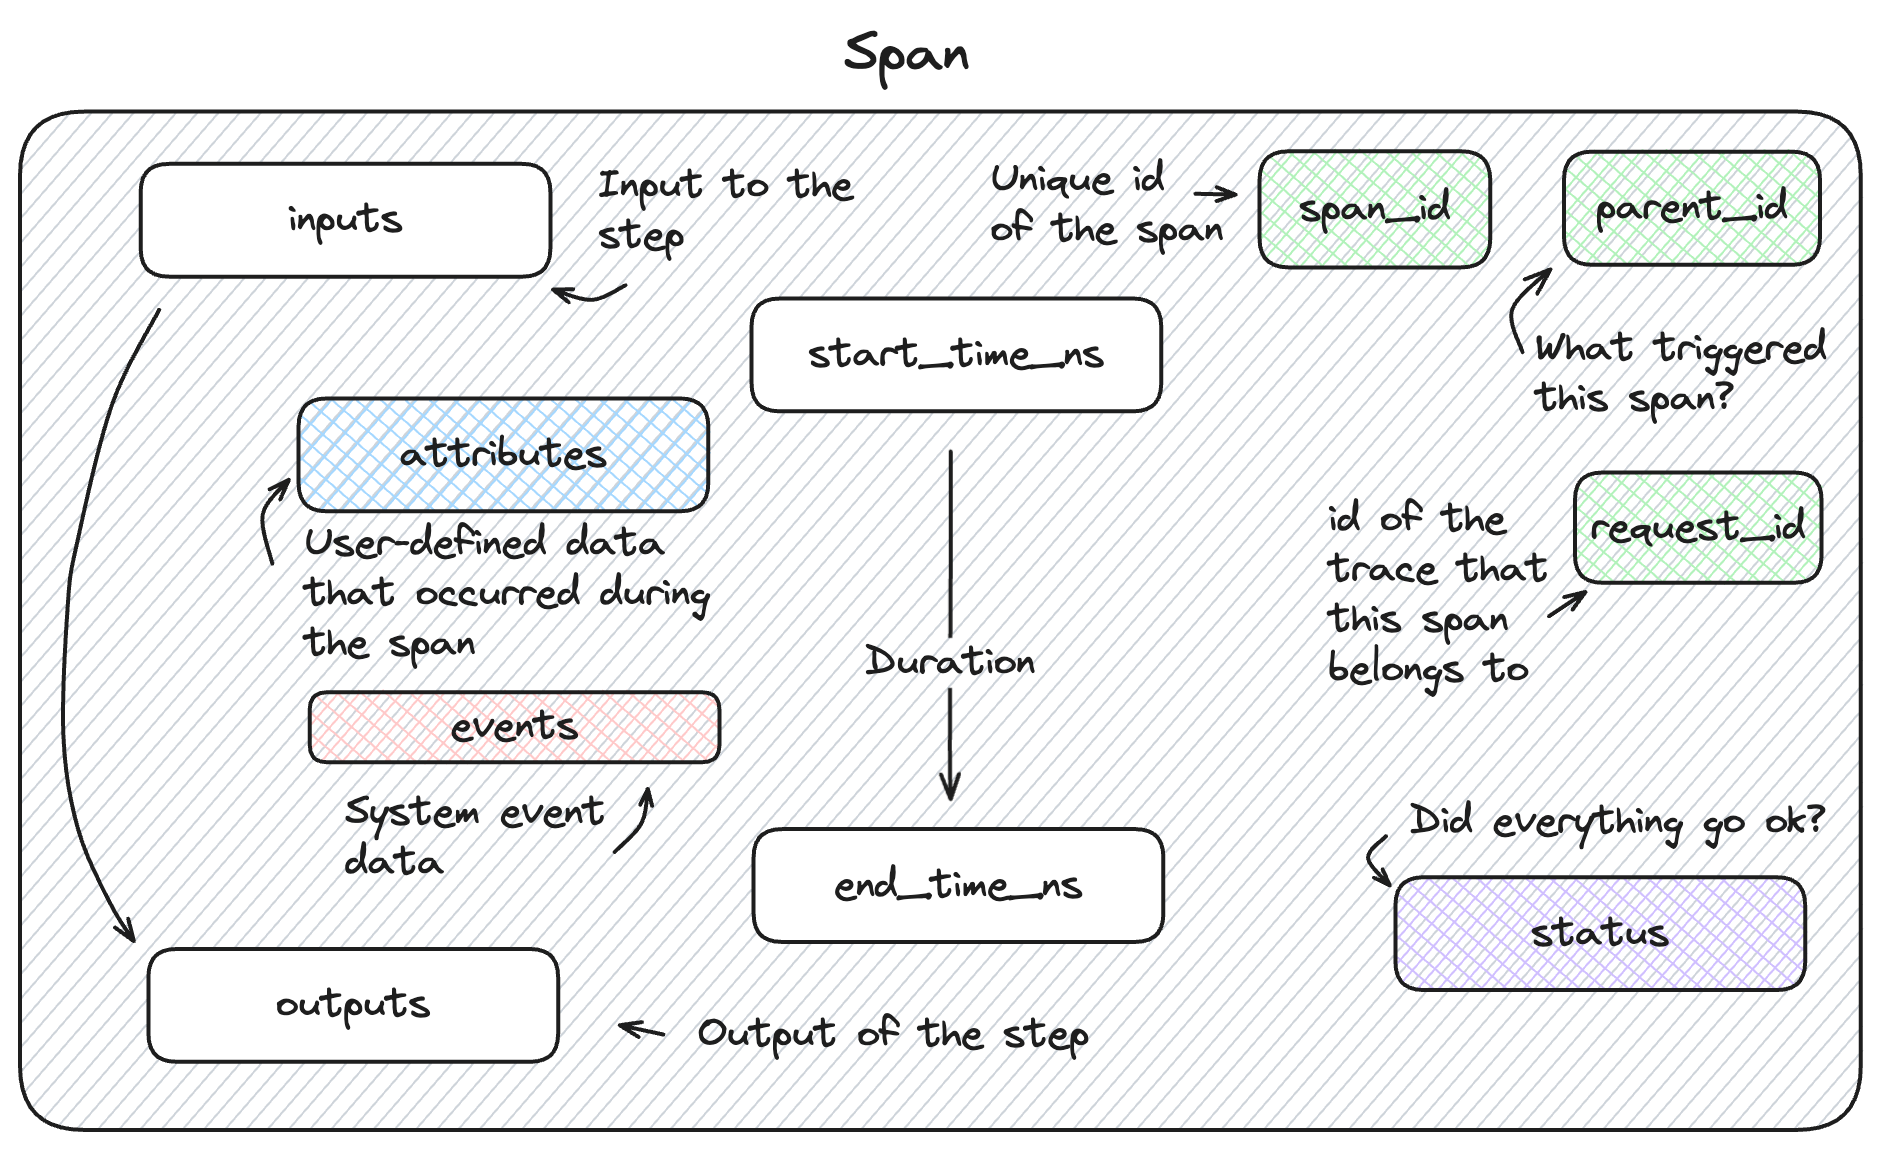
Spans are the fundamental building blocks that represent individual operations. Each span complies with the OpenTelemetry Span specification and includes:
Identity: Unique span ID and parent relationships
Timing: Precise start and end timestamps
Data: Inputs, outputs, and operational metadata
Context: Attributes and events for debugging
Key Concepts
Trace
A trace represents the complete journey of a single request through your application. It's a collection of related operations (spans) that together tell the story of how your system processed a user's input to generate an output.
Example: A user asks "What's the weather in Paris?" - the trace captures everything from parsing the question to returning the final weather report.
Span
A span represents a single, discrete operation within a trace. Each span has a clear beginning and end, and captures the inputs, outputs, timing, and metadata for that specific operation.
Key span properties:
- Name: Human-readable identifier (e.g., "Document Retrieval", "LLM Call")
- Duration: How long the operation took (measured in nanoseconds for precision)
- Status: Success, failure, or error with detailed information
- Inputs: Data that went into the operation (JSON-serialized)
- Outputs: Results produced by the operation (JSON-serialized)
- Attributes: Additional metadata (model parameters, user ID, configuration values)
- Events: Significant moments during execution (errors, warnings, checkpoints)
Parent-Child Relationships
Spans form hierarchical relationships that mirror your application's call structure:
- Root span: The top-level operation representing the entire request
- Child spans: Operations called by parent operations
- Sibling spans: Operations at the same level of the hierarchy
The parent_id property establishes these hierarchical associations, creating a clear order-of-operations linkage.
Span Types
MLflow categorizes spans by their purpose to make traces easier to understand and analyze. Each span type has semantic meaning and may have specialized schemas for enhanced functionality:
- LLM & Chat
- Retrieval & Data
- Workflow & Logic
- Other Types
SpanType.LLM: Calls to language models
SpanType.CHAT_MODEL: Interactions with chat completion APIs
Examples: OpenAI chat completion, Anthropic Claude call, local model inference
Typically captures: model name, parameters, prompt, response, token usage
Special attributes: mlflow.chat.messages and mlflow.chat.tools for rich UI display
SpanType.RETRIEVER: Operations that fetch relevant information
Examples: Vector database search, web search, document lookup
Typically captures: query, retrieved documents, similarity scores, result count
Special schema: Output must be List[Document] for enhanced UI features
SpanType.EMBEDDING: Vector embedding generation
SpanType.PARSER: Data parsing and transformation operations
SpanType.CHAIN: Multi-step workflows or pipelines
Examples: RAG pipeline, multi-agent workflow, complex reasoning chain
SpanType.AGENT: Autonomous agent operations
Examples: Planning steps, decision making, goal-oriented behaviors
SpanType.TOOL: External tool or function calls
Examples: API calls, database queries, file operations, calculations
SpanType.RERANKER: Re-ranking operations for retrieved contexts
SpanType.UNKNOWN: General operations that don't fit other categories
Custom types: You can also define your own span types as strings for specialized operations
Trace Structure Example
Let's examine how these concepts work together in a typical RAG (Retrieval-Augmented Generation) application:
📋 Trace: "Answer User Question" (Root)
├── 🔍 Span: "Query Processing" (UNKNOWN)
│   ├── Input: "What are MLflow's key features?"
│   └── Output: "Processed query: 'mlflow features'"
├── 📚 Span: "Document Retrieval" (RETRIEVER)
│   ├── 🔗 Span: "Embedding Generation" (EMBEDDING)
│   │   ├── Input: "mlflow features"
│   │   └── Output: [0.1, 0.3, -0.2, ...] (vector)
│   └── 🗄️ Span: "Vector Search" (TOOL)
│       ├── Input: {query_vector, top_k: 5}
│       └── Output: [Document(...), Document(...)] (5 docs)
├── 🧠 Span: "Response Generation" (CHAIN)
│   ├── 📝 Span: "Prompt Building" (UNKNOWN)
│   │   ├── Input: {documents, user_query}
│   │   └── Output: "Based on these docs: ... Answer: ..."
│   └── 🤖 Span: "LLM Call" (CHAT_MODEL)
│       ├── Input: {messages, model: "gpt-4", temperature: 0.7}
│       └── Output: "MLflow's key features include..."
└── ✅ Span: "Response Formatting" (UNKNOWN)
    ├── Input: "MLflow's key features include..."
    └── Output: {formatted_response, metadata}
Each span captures specific information relevant to its operation type, and the hierarchical structure shows the logical flow of the application.
Observability Benefits
Understanding these concepts enables several powerful observability capabilities:
Debugging
Root cause analysis: Trace the exact path that led to an error or unexpected result
Performance bottlenecks: Identify which operations consume the most time using precise nanosecond timing
Data flow validation: Verify that data is transformed correctly at each step by examining inputs and outputs
Optimization
Cost tracking: Monitor token usage, API calls, and resource consumption across operations using span attributes
Latency analysis: Understand where delays occur in your application with detailed timing data
Quality correlation: Connect input quality (e.g., retrieval relevance scores) to output quality
Monitoring
System health: Track success rates and error patterns across different components using span status
Usage patterns: Understand how users interact with your application through trace metadata
Trend analysis: Monitor performance and quality changes over time using trace history
Specialized Schemas
Some span types have specialized schemas that enable enhanced functionality:
Retriever Spans
For RETRIEVER spans, the output should conform to a List[Document] structure:
- page_content: The text content of the document
- metadata: Additional context including
doc_urifor links andchunk_idfor evaluation
This enables rich document display in the UI and proper evaluation metric calculation.
Chat Model Spans
For CHAT_MODEL and LLM spans, special attributes provide enhanced conversation display:
- mlflow.chat.messages: Structured conversation data for rich UI rendering
- mlflow.chat.tools: Available tools for function calling scenarios
These attributes can be set using helper functions like mlflow.tracing.set_span_chat_messages().
Use Cases
- GenAI Applications
- RAG Applications
- Traditional ML
GenAI ChatCompletions Use Case
In Generative AI (GenAI) applications, such as chat completions, tracing becomes essential for developers building GenAI-powered applications. These applications involve generating human-like text based on input prompts, and tracing provides visibility into the entire interaction context.
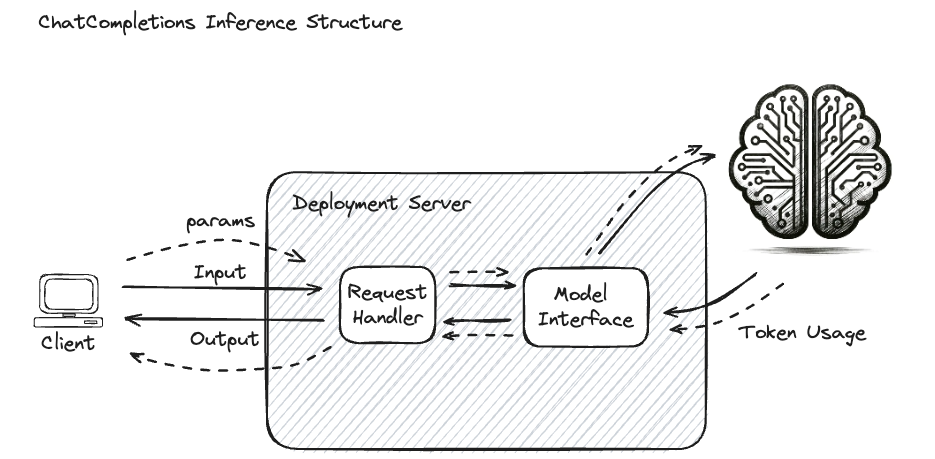
What Tracing Captures
Enabling tracing on chat interfaces allows you to evaluate:
- Full Contextual History: Complete conversation context
- Prompt Engineering: How prompts are constructed and modified
- Input Processing: User input validation and preprocessing
- Configuration Parameters: Model settings and their effects
- Output Generation: Response quality and characteristics
Key Metadata for ChatCompletions
Additional metadata surrounding the inference process is useful for various reasons:
- Token Counts: Number of tokens processed (affects billing and performance)
- Model Name: Specific model used for inference
- Provider Type: Service or platform providing the model (OpenAI, Anthropic, etc.)
- Query Parameters: Settings like temperature, top-k, max_tokens
- Query Input: The request input (user question)
- Query Response: System-generated response
- Latency: Time taken for each operation
- Cost: API costs associated with the request
Example: Enhanced Chat Application
import mlflow
from openai import OpenAI
import time


@mlflow.trace
def enhanced_chat_completion(user_message, conversation_history=None):
    start_time = time.time()

    # Add context to the trace
    mlflow.update_current_trace(
        tags={
            "application": "customer_support_chat",
            "user_type": "premium",
            "conversation_length": len(conversation_history or []),
        }
    )

    # Prepare messages with history
    messages = conversation_history or []
    messages.append({"role": "user", "content": user_message})

    client = OpenAI()
    response = client.chat.completions.create(
        model="gpt-4o-mini", messages=messages, temperature=0.7, max_tokens=500
    )

    # Add performance metrics
    mlflow.update_current_trace(
        tags={
            "response_time_seconds": time.time() - start_time,
            "token_count": response.usage.total_tokens,
            "model_used": response.model,
        }
    )

    return response.choices[0].message.content
Advanced Retrieval-Augmented Generation (RAG) Applications
In more complex applications like Retrieval-Augmented Generation (RAG), tracing becomes essential for effective debugging and optimization. RAG involves multiple stages, including document retrieval, embedding, and interaction with GenAI models.
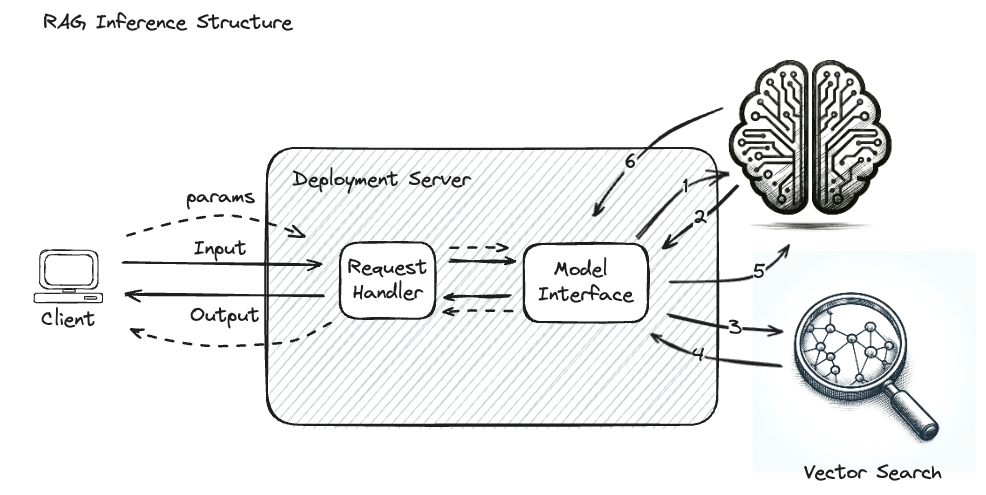
The Challenge Without Tracing
When only the input and output are visible, it becomes challenging to identify the source of issues. If a GenAI system generates an unsatisfactory response, the problem might lie in:
- Vector Store Optimization: Efficiency and accuracy of document retrieval
- Embedding Model: Quality of the model used to encode and search documents
- Reference Material: Content and quality of the documents being queried
- Query Processing: How user queries are transformed for retrieval
- Context Assembly: How retrieved documents are combined with the prompt
Critical Steps in RAG (Often Hidden)
Without tracing, these steps are effectively a "black box":
- Embedding of the input query
- The return of the encoded query vector
- The vector search input
- The retrieved document chunks from the Vector Database
- The final input to the GenAI model
Example: Traced RAG Application
import mlflow
from openai import OpenAI
import numpy as np


@mlflow.trace
def rag_chat_completion(user_question, vector_store):
    # Tag the trace for RAG-specific monitoring
    mlflow.update_current_trace(
        tags={
            "application_type": "rag",
            "vector_store_type": "chromadb",
            "retrieval_strategy": "semantic_search",
        }
    )

    # Step 1: Embed the user question
    embedded_question = embed_query(user_question)

    # Step 2: Retrieve relevant documents
    relevant_docs = retrieve_documents(embedded_question, vector_store)

    # Step 3: Generate response with context
    response = generate_with_context(user_question, relevant_docs)

    return response


@mlflow.trace
def embed_query(query):
    """Convert user query to vector embedding."""
    # Embedding logic here
    mlflow.update_current_trace(
        tags={
            "query_length": len(query),
            "embedding_model": "text-embedding-ada-002",
        }
    )
    # Return embedding vector
    return np.random.rand(1536)  # Placeholder


@mlflow.trace
def retrieve_documents(query_embedding, vector_store, top_k=5):
    """Retrieve relevant documents from vector store."""
    # Vector search logic here
    mlflow.update_current_trace(
        tags={"top_k": top_k, "search_type": "cosine_similarity"}
    )

    # Simulate document retrieval
    documents = [
        {"content": "Document 1 content...", "score": 0.85},
        {"content": "Document 2 content...", "score": 0.82},
    ]

    mlflow.update_current_trace(
        tags={
            "documents_found": len(documents),
            "avg_relevance_score": sum(d["score"] for d in documents) / len(documents),
        }
    )

    return documents


@mlflow.trace
def generate_with_context(question, documents):
    """Generate answer using retrieved context."""
    # Prepare context from documents
    context = "\n".join([doc["content"] for doc in documents])

    mlflow.update_current_trace(
        tags={"context_length": len(context), "num_context_docs": len(documents)}
    )

    # Generate response with context
    client = OpenAI()
    response = client.chat.completions.create(
        model="gpt-4o-mini",
        messages=[
            {"role": "system", "content": f"Answer based on this context: {context}"},
            {"role": "user", "content": question},
        ],
    )

    return response.choices[0].message.content
Benefits of RAG Tracing
With this tracing setup, you can:
- Debug Retrieval Issues: See exactly which documents were retrieved and their relevance scores
- Optimize Embedding: Monitor embedding quality and performance
- Tune Context Assembly: Understand how context affects generation quality
- Monitor Performance: Track latency at each stage of the pipeline
- Analyze Failures: Identify which component caused issues
Beyond GenAI: Tracing for Traditional Machine Learning
While this documentation focuses on GenAI applications where tracing provides the most value, MLflow Tracing can also be applied to traditional ML workflows for monitoring and performance analysis.
In traditional ML, the inference process is relatively straightforward compared to GenAI applications. When a request is made, input data is fed into the model, which processes the data and generates a prediction.
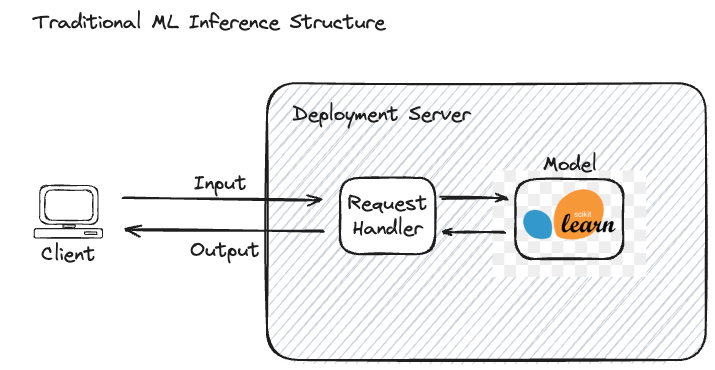
Traditional ML Characteristics
- Transparent Process: Both input and output are clearly defined and understandable
- Deterministic: Same input typically produces the same output
- Single Model: Usually involves one primary model for prediction
- Structured Data: Often works with tabular or well-defined data formats
Example: Spam Detection Model
# Input: Email text
email_text = "Congratulations! You've won $1000. Click here to claim..."

# Output: Binary classification
is_spam = True  # or False
This process is wholly visible - the email content and spam/not-spam label are both interpretable.
When Tracing Helps in Traditional ML
While qualitative model performance assessment may not require tracing, it can still provide value for:
1. Performance Monitoring
import mlflow
import time


@mlflow.trace
def predict_fraud(transaction_data):
    start_time = time.time()

    # Preprocess the data
    processed_data = preprocess_transaction(transaction_data)

    # Make prediction
    prediction = fraud_model.predict(processed_data)

    # Log performance metrics
    mlflow.update_current_trace(
        tags={
            "prediction_time_ms": (time.time() - start_time) * 1000,
            "model_version": "v2.1.0",
            "confidence_score": prediction.probability,
        }
    )

    return prediction
2. API Access Logging
@mlflow.trace
def ml_api_endpoint(request_data, user_id):
    mlflow.update_current_trace(
        tags={"user_id": user_id, "api_version": "v1", "endpoint": "/predict"}
    )

    # Process request and return prediction
    result = make_prediction(request_data)

    mlflow.update_current_trace(
        tags={
            "request_size_bytes": len(str(request_data)),
            "response_size_bytes": len(str(result)),
        }
    )

    return result
3. Multi-Model Pipelines
@mlflow.trace
def ensemble_prediction(input_data):
    # Use multiple models in sequence
    preprocessed = preprocessing_model(input_data)
    features = feature_extraction_model(preprocessed)
    prediction = final_model(features)

    return prediction
Differences from GenAI Tracing
| Aspect | Traditional ML | GenAI Applications |
|---|---|---|
| Complexity | Simple input → output | Multi-step, contextual processes |
| Transparency | High (interpretable I/O) | Low (complex internal processing) |
| Debugging Need | Performance & infrastructure | Quality, relevance, hallucinations |
| Trace Value | Operational monitoring | Essential for development & debugging |
Getting Started with Concepts
Now that you understand these fundamental concepts:
Instrument Your App: Learn how to add tracing to your applications
Trace Data Model: Explore the detailed schema and API reference
Automatic Tracing: Enable one-line tracing for supported libraries
Manual Tracing: Create custom spans for your application logic
These concepts form the foundation for understanding how MLflow Tracing provides observability into your GenAI applications. The hierarchical structure of traces and spans, combined with rich metadata capture and specialized schemas, enables deep insights into your application's behavior and performance.