Trace Data Model
This document provides a detailed overview of the MLflow Trace data model. Understanding this model is key to leveraging MLflow Tracing for observability and analysis of your Generative AI applications.
MLflow Traces are designed to be compatible with OpenTelemetry specifications, a widely adopted industry standard for observability. This ensures interoperability and allows MLflow Traces to be exported and used with other OpenTelemetry-compatible systems. MLflow enhances the basic OpenTelemetry Span model by defining specific structures and attributes for Generative AI use cases, providing richer context and deeper insight into quality and performance.
Structure of Traces
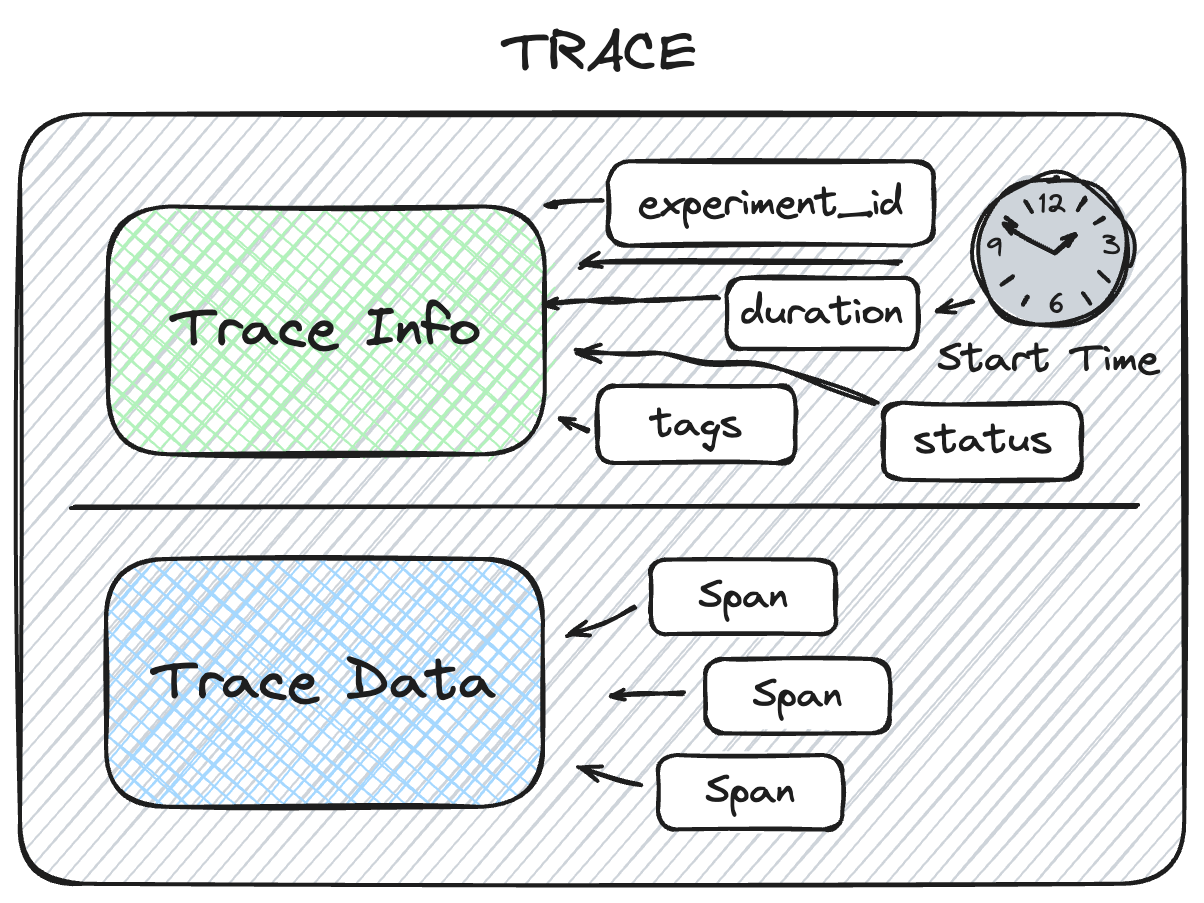
At a high level, an MLflow Trace is composed of two primary objects:
TraceInfo: Metadata that aids in explaining the origination of the trace, the status of the trace, information about the total execution time, etc. This includes tags that provide additional context for the trace, such as the user, session, and developer-provided key:value pairs. Tags can be used for searching or filtering traces.
TraceData: The actual payload, which contains the instrumented Span objects that capture your application's step-by-step execution from input to output.
Check the API documentation for helper methods on these dataclass objects for more information on how to convert or extract data from them.
TraceInfo: Metadata and Context
The TraceInfo within MLflow's tracing feature aims to provide a lightweight snapshot of critical data about the overall trace. TraceInfo is a dataclass object that contains metadata about the trace.
This metadata includes information about the trace's origin, status, and various other data that aids in retrieving and filtering traces when used with mlflow.search_traces() and for navigation of traces within the MLflow UI.
- Core Fields
- Request & Response
- Metadata & Organization
trace_id (str): The primary identifier for the trace.
trace_location (TraceLocation): The location where the trace is stored, represented as a TraceLocation object. MLflow currently supports MLflow Experiment as a trace location.
request_time (int): Start time of the trace, in milliseconds.
state (TraceState): State of the trace, represented as a TraceState enum. Can be one of [OK, ERROR, IN_PROGRESS, STATE_UNSPECIFIED].
execution_duration (Optional[int]): Duration of the trace, in milliseconds.
request_preview (Optional[str]): Request to the model/agent, equivalent to the input of the root span but JSON-encoded and can be truncated.
response_preview (Optional[str]): Response from the model/agent, equivalent to the output of the root span but JSON-encoded and can be truncated.
These preview fields provide a quick overview of what the trace processed without needing to examine the detailed span data.
client_request_id (Optional[str]): Client supplied request ID associated with the trace. This could be used to identify the trace/request from an external system that produced the trace, e.g., a session ID in a web application.
trace_metadata (dict[str, str]): Key-value pairs associated with the trace. They are designed for immutable values like run ID associated with the trace.
tags (dict[str, str]): Tags associated with the trace. They are designed for mutable values, that can be updated after the trace is created via MLflow UI or API.
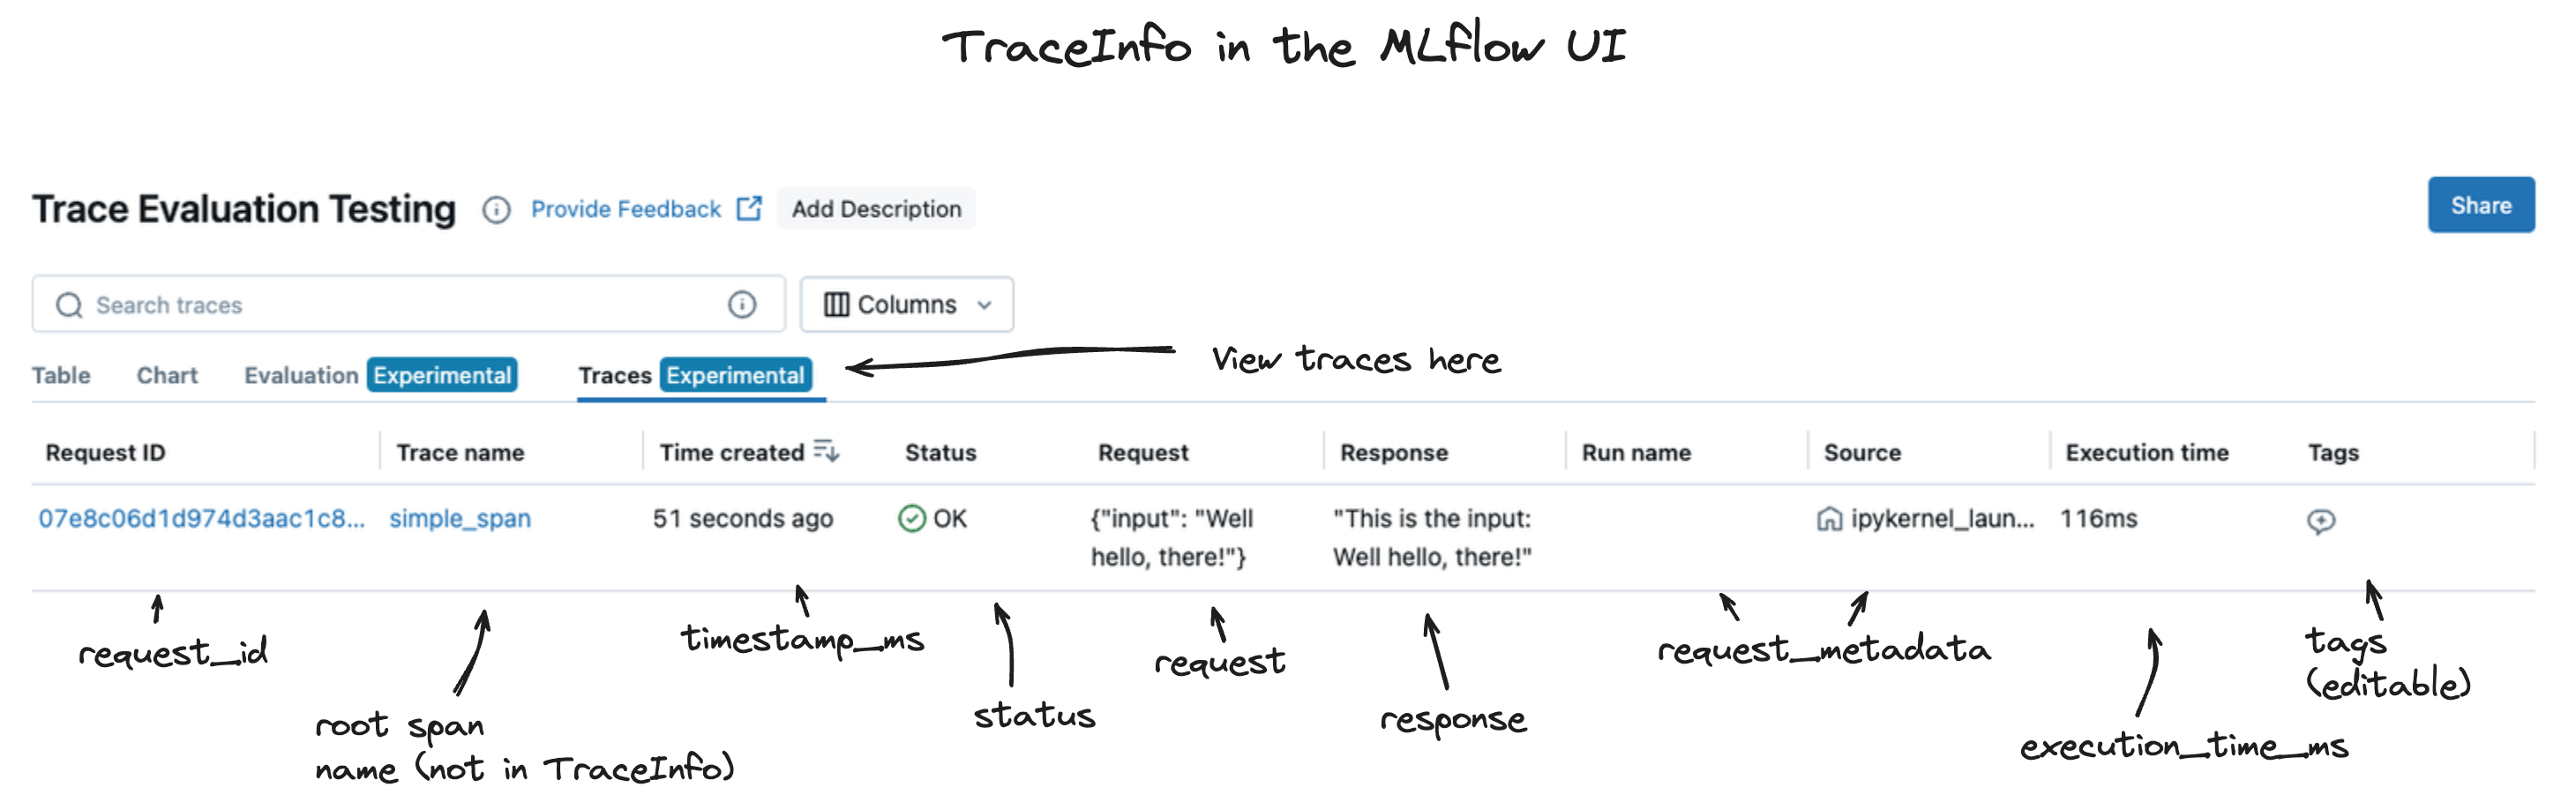
The data that is contained in the TraceInfo object is used to populate the trace view page within the MLflow tracking UI.
Tags
The tags property in MLflow's TraceInfo object is used to provide additional context for the trace. These tags can be used for searching, filtering, or providing additional information about the trace.
The tags are key-value pairs, and they are mutable. This means that you can add, modify, or remove tags at any time, even after the trace has been logged to an experiment.
Standard Tags
MLflow uses a set of standard tags for common contextual information about users, sessions and the environment, which enable enhanced filtering and grouping capabilities within the MLflow UI and SDK:
mlflow.trace.session: Standard tag for session ID
mlflow.trace.user: Standard tag for user ID
mlflow.source.name: The entry point or script that generated the trace
mlflow.source.git.commit: If run from a Git repository, the commit hash of the source code
mlflow.source.type: The type of source that generated the trace, commonly PROJECT (for MLflow Project runs) or NOTEBOOK (if run from a notebook)
Custom Tags for Advanced Use Cases
For enterprise and distributed applications, custom tags enable powerful filtering and organization:
Business Context Tags:
# Business-specific identification
mlflow.update_current_trace(
    tags={
        "business.user_id": "user123",
        "business.tenant_id": "tenant_456",
        "business.cost_center": "engineering",
        "business.department": "ai_platform",
    }
)
Deployment and Environment Tags:
# Deployment context
mlflow.update_current_trace(
    tags={
        "deployment.environment": "production",
        "deployment.region": "us-west-2",
        "deployment.service": "recommendation_engine",
        "deployment.version": "v2.3.1",
    }
)
Performance and Quality Tags:
# Performance monitoring
mlflow.update_current_trace(
    tags={
        "performance.tier": "premium",
        "quality.confidence_threshold": "0.8",
        "feature.experimental": "true",
        "monitoring.alert_level": "high",
    }
)
TraceData: Execution Details
The MLflow TraceData object, accessible via Trace.data, holds the core payload of the trace. It primarily contains the sequence of operations (spans) that occurred, along with the initial request that triggered the trace and the final response produced.
- Spans
- Request & Response
spans (List[Span]): This is a list of Span objects (conforming to OpenTelemetry specifications) that represent the individual steps, operations, or function calls within the trace. Each span details a specific unit of work.
Spans are organized hierarchically via parent_id to represent the execution flow.
See the Span Schema section below for a detailed breakdown of a Span object.
request (str): A JSON-serialized string representing the input data for the root span of the trace. This is typically the end-user's request or the initial parameters that invoked the traced application or workflow.
Example: '{"query": "What is MLflow Tracing?", "user_id": "user123"}'
response (str): A JSON-serialized string representing the final output data from the root span of the traced application or workflow.
Example: '{"answer": "MLflow Tracing provides observability...", "confidence": 0.95}'
The request and response properties are preserved for backward compatibility. Their values are looked up from the respective inputs and outputs attribute of the root span and are not set directly by the user on the TraceData object.
Understanding TraceData is key to programmatically analyzing the detailed execution path and the data transformations that occur throughout your GenAI application's lifecycle.
Span Schema
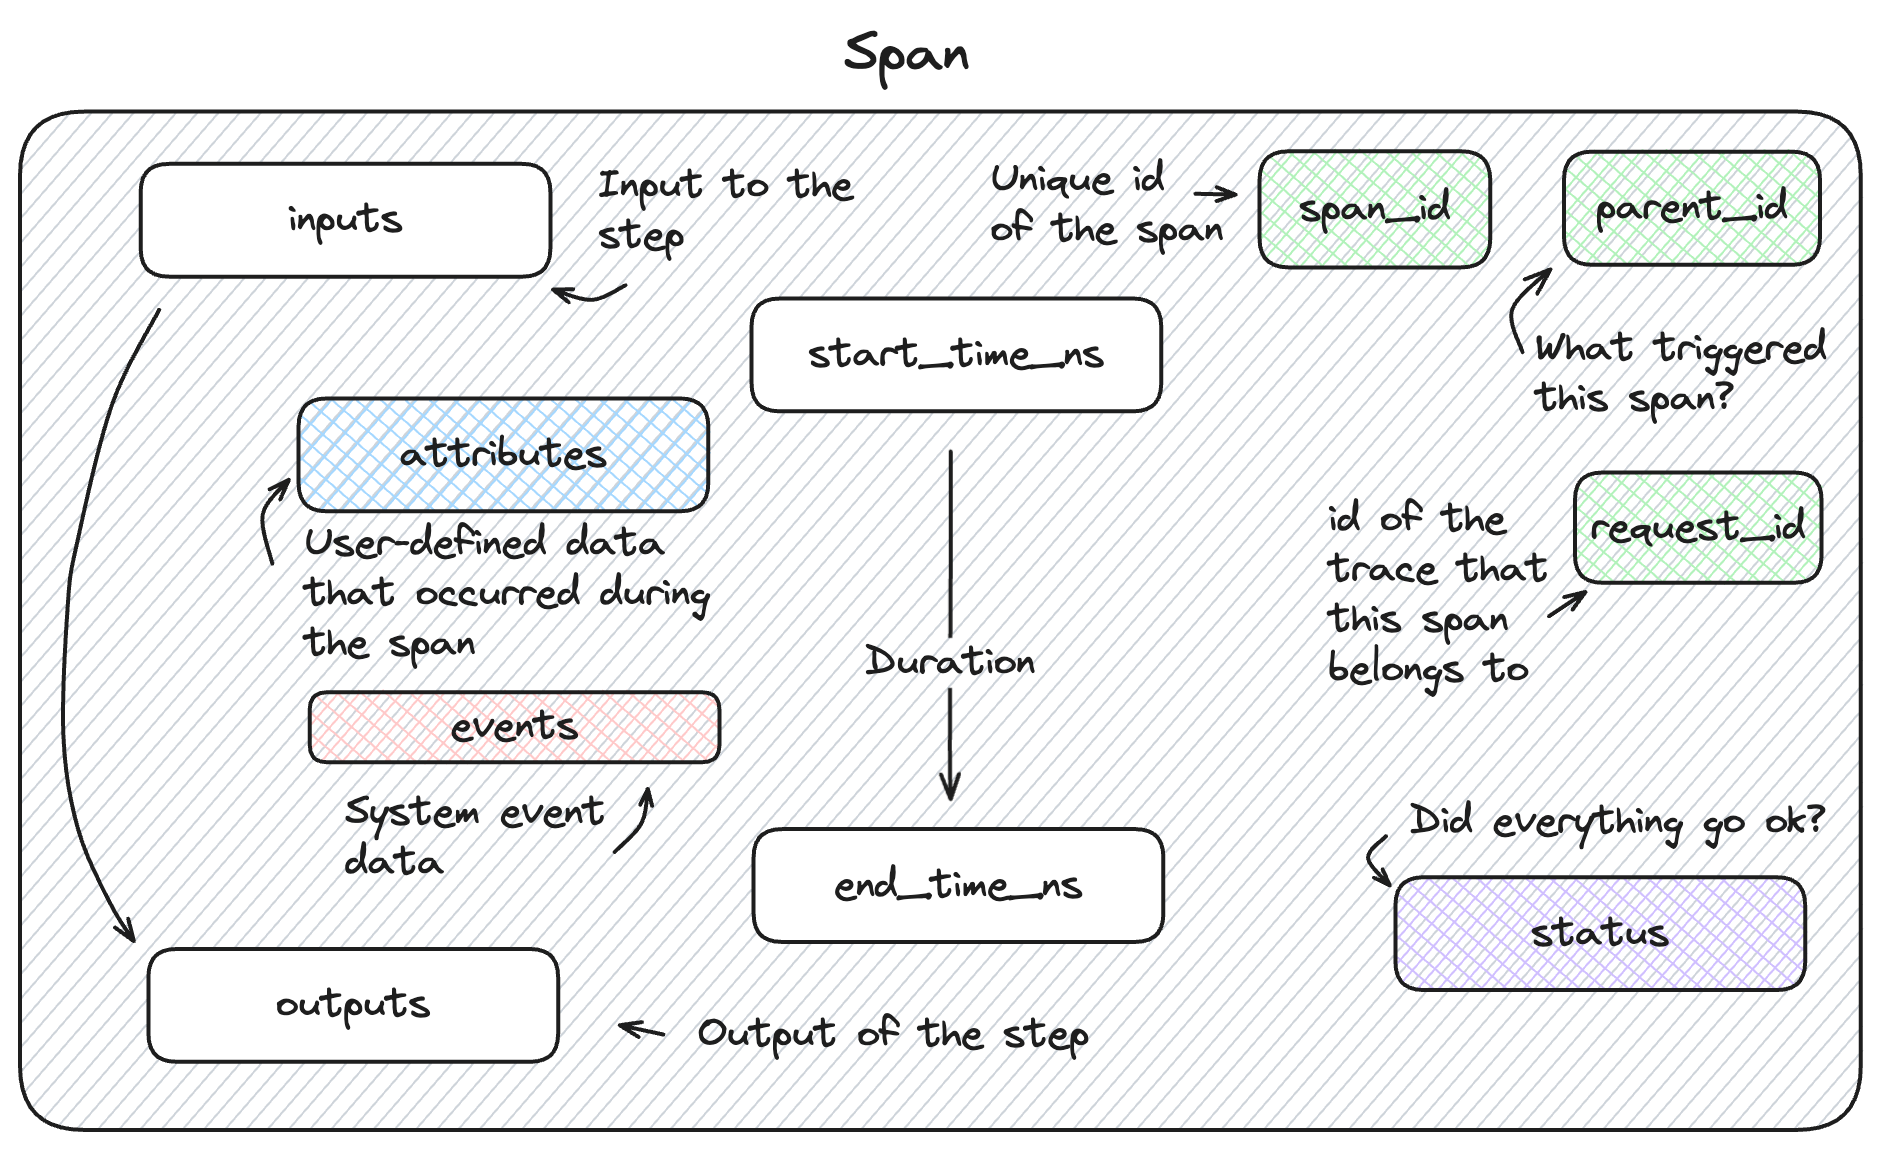
The Span object within MLflow's tracing feature provides detailed information about the individual steps of the trace. It complies with the OpenTelemetry Span spec.
Each Span object contains information about the step being instrumented, including the span_id, name, start_time, parent_id, status, inputs, outputs, attributes, and events.
Core Span Properties
- Identity & Hierarchy
- Timing & Status
- Data & Context
span_id (str): A unique identifier that is generated for each span within a trace.
trace_id (str): The unique identifier that links this span to its parent trace.
parent_id (Optional[str]): The identifier that establishes the hierarchical association of a given span with its parent span.
name (str): The name of the span, either user-defined or automatically generated based on the function or method being instrumented.
start_time_ns (int): The unix timestamp (in nanoseconds) when the span was started.
end_time_ns (int): The unix timestamp (in nanoseconds) when the span was ended.
status (SpanStatus): The status of a span with values of OK, UNSET, or ERROR. The span status object contains an optional description if the status_code is reflecting an error that occurred.
inputs (Optional[Any]): The inputs are stored as JSON-serialized data, representing the input data that is passed into the particular stage of your application.
outputs (Optional[Any]): The outputs are stored as JSON-serialized data, representing the output data that is passed out of the particular stage of your application.
attributes (Dict[str, Any]): Attributes are metadata that are associated with a given step within your application. These are key-value pairs that provide insight into behavioral modifications for function and method calls.
events (List[SpanEvent]): Events are a system-level property that is optionally applied to a span only if there was an issue during the execution of the span. These events contain information about exceptions that were thrown in the instrumented call, as well as the stack trace.
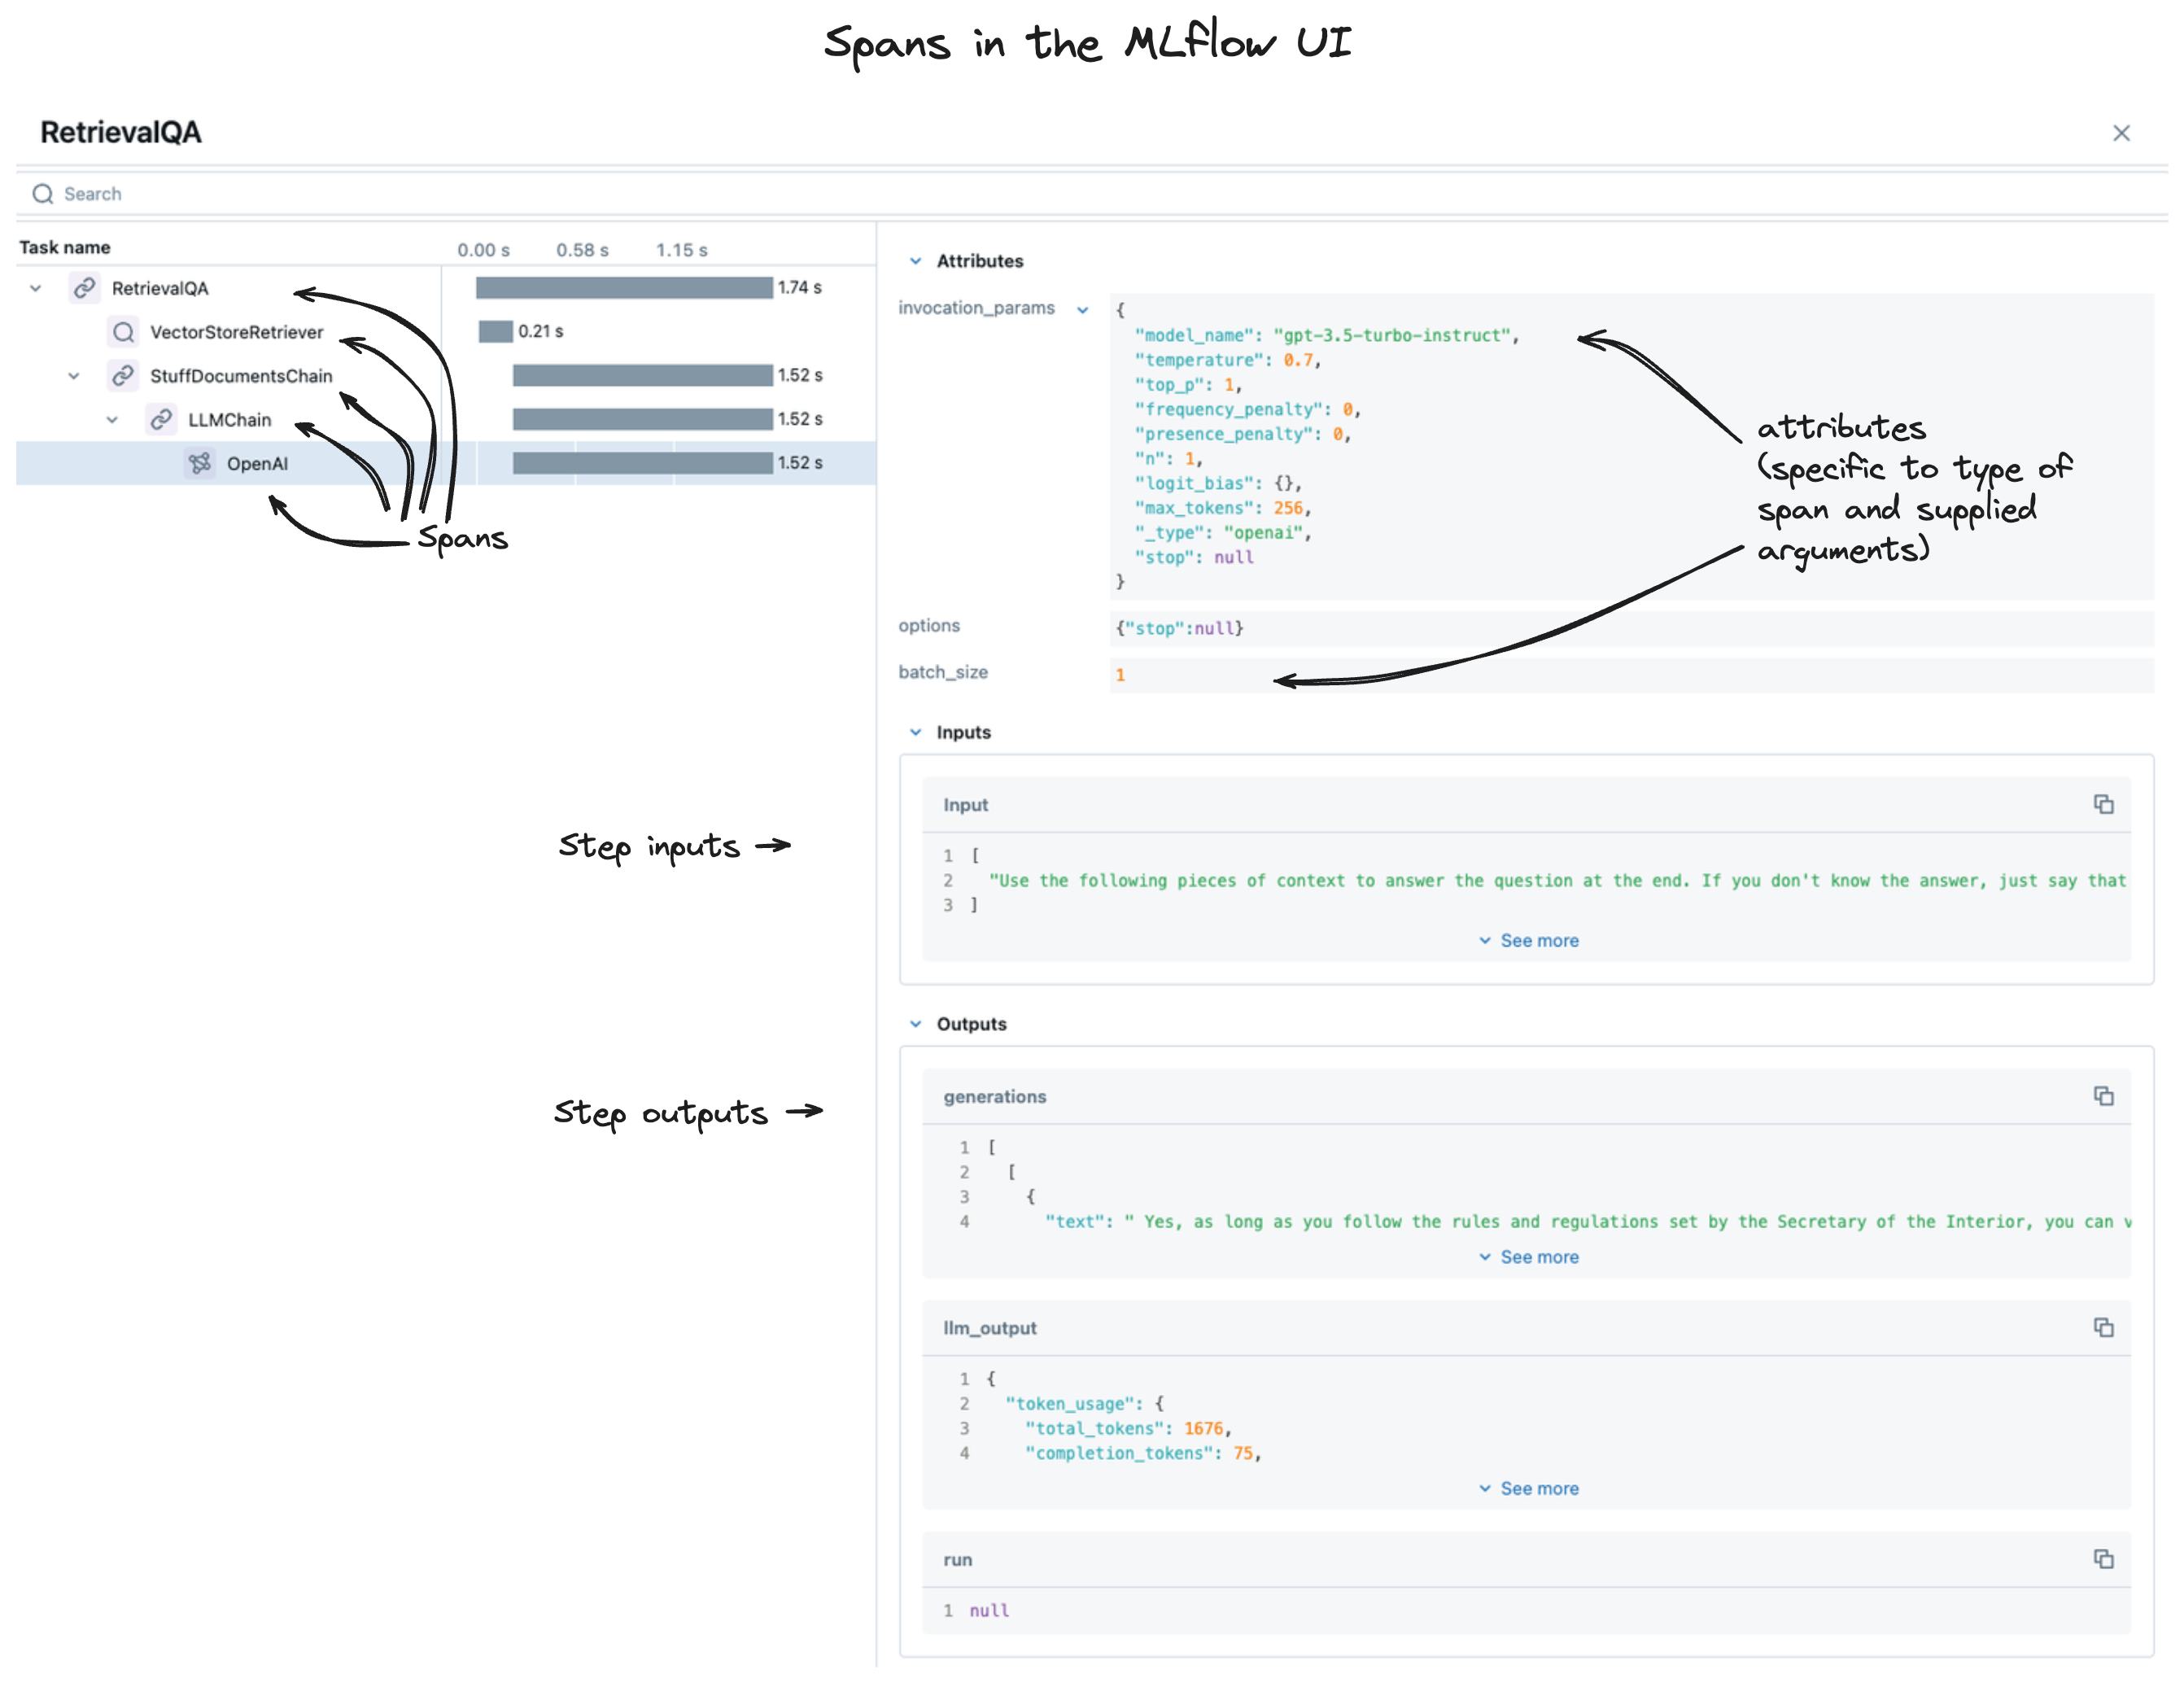
When you view your traces within the MLflow UI, you're looking at a collection of spans, as shown below:
Advanced Span Attributes
For production and enterprise use cases, spans can include rich contextual attributes:
Model and Infrastructure Attributes:
span.set_attributes(
    {
        "ai.model.name": "gpt-4",
        "ai.model.version": "2024-01-01",
        "ai.model.provider": "openai",
        "ai.model.temperature": 0.7,
        "ai.model.max_tokens": 1000,
        "infrastructure.gpu.type": "A100",
        "infrastructure.memory.used_mb": 2048,
    }
)
Business Logic Attributes:
span.set_attributes(
    {
        "business.operation.type": "content_generation",
        "business.user.tier": "premium",
        "business.request.priority": "high",
        "business.cost.estimate_usd": 0.02,
        "business.compliance.region": "eu-west-1",
    }
)
Performance and Quality Attributes:
span.set_attributes(
    {
        "performance.cache.hit": True,
        "performance.retry.count": 0,
        "quality.confidence.score": 0.95,
        "quality.toxicity.score": 0.02,
        "monitoring.latency.p99": 150.5,
    }
)
Span Types
Span types are a way to categorize spans within a trace. By default, the span type is set to "UNKNOWN" when using the trace decorator. MLflow provides a set of predefined span types for common use cases, while also allowing you to set custom span types.
- Built-in Types
- Usage Examples
- Custom Span Types
| Span Type | Description |
|---|---|
"CHAT_MODEL" | Represents a query to a chat model. This is a special case of an LLM interaction. |
"CHAIN" | Represents a chain of operations. |
"AGENT" | Represents an autonomous agent operation. |
"TOOL" | Represents a tool execution (typically by an agent), such as querying a search engine. |
"EMBEDDING" | Represents a text embedding operation. |
"RETRIEVER" | Represents a context retrieval operation, such as querying a vector database. |
"PARSER" | Represents a parsing operation, transforming text into a structured format. |
"RERANKER" | Represents a re-ranking operation, ordering the retrieved contexts based on relevance. |
"UNKNOWN" | A default span type that is used when no other span type is specified. |
To set a span type, you can pass the span_type parameter to the mlflow.trace() decorator or mlflow.start_span() context manager. When you are using automatic tracing, the span type is automatically set by MLflow.
import mlflow
from mlflow.entities import SpanType


# Using a built-in span type
@mlflow.trace(span_type=SpanType.RETRIEVER)
def retrieve_documents(query: str):
    ...


# Setting a custom span type
with mlflow.start_span(name="add", span_type="MATH") as span:
    span.set_inputs({"x": x, "y": y})
    z = x + y
    span.set_outputs({"z": z})

    print(span.span_type)
    # Output: MATH
For specialized applications, you can define custom span types that reflect your domain:
# Financial services
@mlflow.trace(span_type="RISK_ASSESSMENT")
def assess_credit_risk(application):
    ...


@mlflow.trace(span_type="FRAUD_DETECTION")
def detect_fraud(transaction):
    ...


# Healthcare
@mlflow.trace(span_type="DIAGNOSIS")
def generate_diagnosis(symptoms):
    ...


@mlflow.trace(span_type="TREATMENT_RECOMMENDATION")
def recommend_treatment(diagnosis):
    ...


# E-commerce
@mlflow.trace(span_type="PRODUCT_RECOMMENDATION")
def recommend_products(user_profile):
    ...


@mlflow.trace(span_type="INVENTORY_CHECK")
def check_inventory(product_id):
    ...
Specialized Span Schemas
MLflow has predefined types of spans, and certain span types have properties that are required in order to enable additional functionality within the UI and downstream tasks such as evaluation.
Retriever Spans
The RETRIEVER span type is used for operations involving retrieving data from a data store (for example, querying documents from a vector store). The output of a RETRIEVER span is expected to be a list of documents.
Each document in the list should be a dictionary with the following structure:
page_content (str): The text content of the retrieved document chunk.
metadata (Optional[Dict[str, Any]]): A dictionary of additional metadata associated with the document. MLflow UI and evaluation metrics may specifically look for:
doc_uri(str): A string URI for the document sourcechunk_id(str): A string identifier if the document is part of a larger chunked document
id (Optional[str]): An optional unique identifier for the document chunk itself.
Example Usage
import mlflow
from mlflow.entities import SpanType, Document


def search_store(query: str) -> list[tuple[str, str]]:
    # Simulate retrieving documents (e.g., from a vector database)
    return [
        (
            "MLflow Tracing helps debug GenAI applications...",
            "docs/mlflow/tracing_intro.md",
        ),
        (
            "Key components of a trace include spans...",
            "docs/mlflow/tracing_datamodel.md",
        ),
        ("MLflow provides automatic instrumentation...", "docs/mlflow/auto_trace.md"),
    ]


@mlflow.trace(span_type=SpanType.RETRIEVER)
def retrieve_relevant_documents(query: str):
    # Get documents from the search store
    docs = search_store(query)

    # Get the current active span (created by @mlflow.trace)
    span = mlflow.get_current_active_span()

    # Set the outputs of the span in accordance with the tracing schema
    outputs = [
        Document(page_content=doc, metadata={"doc_uri": uri}) for doc, uri in docs
    ]
    span.set_outputs(outputs)

    # Return the original format for downstream usage
    return docs


# Example usage
user_query = "MLflow Tracing benefits"
retrieved_docs = retrieve_relevant_documents(user_query)
Advanced Retriever Example with Rich Metadata
@mlflow.trace(span_type=SpanType.RETRIEVER)
def advanced_retrieval(query: str, top_k: int = 5):
    """Advanced document retrieval with comprehensive metadata"""

    # Simulate vector database query with scores and metadata
    results = vector_db.similarity_search_with_score(
        query=query, k=top_k, filter={"status": "active"}
    )

    span = mlflow.get_current_active_span()

    # Rich document structure with comprehensive metadata
    documents = []
    for doc, score in results:
        document = {
            "page_content": doc.page_content,
            "metadata": {
                "doc_uri": doc.metadata.get("source_url"),
                "chunk_id": doc.metadata.get("chunk_id"),
                "document_title": doc.metadata.get("title"),
                "author": doc.metadata.get("author"),
                "creation_date": doc.metadata.get("created_at"),
                "document_type": doc.metadata.get("type"),
                "similarity_score": float(score),
                "retrieval_timestamp": time.time(),
                "chunk_position": doc.metadata.get("chunk_index"),
                "total_chunks": doc.metadata.get("total_chunks"),
            },
            "id": doc.metadata.get("doc_id"),
        }
        documents.append(document)

    # Set additional span attributes for debugging and analysis
    span.set_attributes(
        {
            "retrieval.query_length": len(query),
            "retrieval.results_count": len(documents),
            "retrieval.avg_similarity": sum(
                d["metadata"]["similarity_score"] for d in documents
            )
            / len(documents),
            "retrieval.database": "production_vector_db",
            "retrieval.index_name": "knowledge_base_v2",
        }
    )

    span.set_outputs(documents)
    return documents
Conforming to this structure, especially including page_content and relevant metadata like doc_uri, will ensure that RETRIEVER spans are rendered informatively in the MLflow UI and that downstream evaluation tasks can correctly process the retrieved context.
Chat Completion Spans
Spans of type CHAT_MODEL or LLM are used to represent interactions with a chat completions API (for example, OpenAI's chat completions or Anthropic's messages API). These spans can also capture information about tools (functions) made available to or used by the model.
As providers can have different schemas for their API, there are no strict restrictions on the format of the span's inputs and outputs for the raw LLM call itself. However, to enable rich UI features (like conversation display and tool call visualization) and to standardize data for evaluation, MLflow defines specific attributes for chat messages and tool definitions.
Special Attributes
mlflow.chat.messages: This attribute represents the system/user/assistant messages involved in the conversation with the chat model. The type must be List[ChatMessage].
mlflow.chat.tools: This attribute represents the tools that were available for the chat model to call. The type must be List[ChatTool].
These attributes can be conveniently set using helper functions like mlflow.tracing.set_span_chat_messages() and mlflow.tracing.set_span_chat_tools().
Example Usage
import mlflow
from mlflow.entities import SpanType
from mlflow.tracing.constant import SpanAttributeKey
from mlflow.tracing import set_span_chat_messages, set_span_chat_tools

# Example messages and tools
messages = [
    {
        "role": "system",
        "content": "please use the provided tool to answer the user's questions",
    },
    {"role": "user", "content": "what is 1 + 1?"},
]

tools = [
    {
        "type": "function",
        "function": {
            "name": "add",
            "description": "Add two numbers",
            "parameters": {
                "type": "object",
                "properties": {
                    "a": {"type": "number"},
                    "b": {"type": "number"},
                },
                "required": ["a", "b"],
            },
        },
    }
]


@mlflow.trace(span_type=SpanType.CHAT_MODEL)
def call_chat_model(messages, tools):
    # Mocking a response
    response = {
        "role": "assistant",
        "tool_calls": [
            {
                "id": "123",
                "function": {"arguments": '{"a": 1,"b": 2}', "name": "add"},
                "type": "function",
            }
        ],
    }

    combined_messages = messages + [response]

    span = mlflow.get_current_active_span()
    set_span_chat_messages(span, combined_messages)
    set_span_chat_tools(span, tools)

    return response


call_chat_model(messages, tools)

last_trace_id = mlflow.get_last_active_trace_id()
trace = mlflow.get_trace(trace_id=last_trace_id)
span = trace.data.spans[0]

print("Messages: ", span.get_attribute(SpanAttributeKey.CHAT_MESSAGES))
print("Tools: ", span.get_attribute(SpanAttributeKey.CHAT_TOOLS))
Advanced Chat Model Span with Rich Context
@mlflow.trace(span_type=SpanType.CHAT_MODEL)
def advanced_chat_completion(messages, model_config, user_context):
    """Advanced chat completion with comprehensive tracking"""

    span = mlflow.get_current_active_span()

    # Set rich model and request attributes
    span.set_attributes(
        {
            "ai.model.name": model_config["model"],
            "ai.model.provider": "openai",
            "ai.model.temperature": model_config.get("temperature", 0.7),
            "ai.model.max_tokens": model_config.get("max_tokens", 1000),
            "ai.model.top_p": model_config.get("top_p", 1.0),
            "ai.request.user_tier": user_context.get("tier", "standard"),
            "ai.request.session_id": user_context.get("session_id"),
            "ai.request.conversation_length": len(messages),
            "ai.request.estimated_cost_usd": estimate_cost(messages, model_config),
        }
    )

    # Make the actual API call
    response = openai_client.chat.completions.create(messages=messages, **model_config)

    # Extract response details
    completion = response.choices[0].message
    usage = response.usage

    # Set response attributes
    span.set_attributes(
        {
            "ai.response.tokens.input": usage.prompt_tokens,
            "ai.response.tokens.output": usage.completion_tokens,
            "ai.response.tokens.total": usage.total_tokens,
            "ai.response.finish_reason": response.choices[0].finish_reason,
            "ai.response.model_used": response.model,
            "ai.response.has_tool_calls": bool(completion.tool_calls),
            "ai.response.actual_cost_usd": calculate_actual_cost(
                usage, model_config["model"]
            ),
        }
    )

    # Prepare messages for MLflow schema
    all_messages = messages + [completion.dict()]
    set_span_chat_messages(span, all_messages)

    # Set tools if they were provided
    if "tools" in model_config:
        set_span_chat_tools(span, model_config["tools"])

    return response
Working with Trace Data
Understanding the trace data model enables several powerful use cases:
Programmatic Analysis
Query specific spans: Search for spans by type, name, or attributes to analyze specific operations
Extract metrics: Calculate performance metrics like latency, success rates, and resource usage
Data flow analysis: Trace how data transforms through your application pipeline
Cost tracking: Monitor AI model usage and associated costs across different user tiers
Quality Assessment
Input/output validation: Verify that data is processed correctly at each step
Error analysis: Examine failed spans to understand failure patterns
Performance optimization: Identify bottlenecks and optimization opportunities
A/B testing: Compare trace patterns across different model versions or configurations
Integration with Evaluation
Trace-based evaluation: Use trace data as input for quality assessment
Span-level metrics: Evaluate individual operations within larger workflows
Historical comparison: Compare trace patterns across different versions or configurations
Business metrics: Track custom business KPIs through span attributes and tags
Advanced Analytics and Monitoring
Cost Analysis Example
def analyze_costs_by_user_tier(traces):
    """Analyze AI model costs by user tier"""
    cost_by_tier = {}

    for trace in traces:
        user_tier = trace.info.tags.get("business.user.tier", "unknown")

        for span in trace.data.spans:
            if span.span_type == "CHAT_MODEL":
                cost = span.attributes.get("ai.response.actual_cost_usd", 0)
                if user_tier not in cost_by_tier:
                    cost_by_tier[user_tier] = []
                cost_by_tier[user_tier].append(cost)

    return {tier: sum(costs) for tier, costs in cost_by_tier.items()}
Performance Monitoring Example
def monitor_retrieval_performance(traces):
    """Monitor retrieval system performance"""
    retrieval_metrics = []

    for trace in traces:
        for span in trace.data.spans:
            if span.span_type == "RETRIEVER":
                metrics = {
                    "query_time_ms": (span.end_time_ns - span.start_time_ns)
                    / 1_000_000,
                    "results_count": span.attributes.get("retrieval.results_count", 0),
                    "avg_similarity": span.attributes.get(
                        "retrieval.avg_similarity", 0
                    ),
                    "database": span.attributes.get("retrieval.database"),
                    "timestamp": span.start_time_ns / 1_000_000_000,
                }
                retrieval_metrics.append(metrics)

    return retrieval_metrics
Error Pattern Analysis
def analyze_error_patterns(traces):
    """Analyze common error patterns across traces"""
    error_patterns = {}

    for trace in traces:
        if trace.info.state == "ERROR":
            for span in trace.data.spans:
                if span.status.status_code == "ERROR":
                    error_type = span.attributes.get("error_type", "unknown")
                    operation = span.name

                    pattern_key = f"{operation}:{error_type}"
                    if pattern_key not in error_patterns:
                        error_patterns[pattern_key] = {
                            "count": 0,
                            "examples": [],
                            "user_tiers": set(),
                        }

                    error_patterns[pattern_key]["count"] += 1
                    error_patterns[pattern_key]["examples"].append(
                        span.attributes.get("error_message", "")[:100]
                    )
                    error_patterns[pattern_key]["user_tiers"].add(
                        trace.info.tags.get("business.user.tier", "unknown")
                    )

    return error_patterns
Next Steps
Tracing Concepts: Understand the fundamental concepts behind tracing
Querying Traces: Learn how to search and retrieve trace data programmatically
Automatic Tracing: Get started with one-line tracing for supported libraries
Manual Tracing: Create custom spans for detailed instrumentation
Understanding the trace data model is essential for leveraging MLflow Tracing effectively. The hierarchical structure of traces and spans, combined with rich metadata and specialized schemas, enables comprehensive observability and analysis of your GenAI applications.