Search Traces
This guide will walk you through how to search for traces in MLflow using both the MLflow UI and Python API. This resource will be valuable if you're interested in querying specific traces based on their metadata, tags, execution time, status, or other trace attributes.
MLflow's trace search functionality allows you to leverage SQL-like syntax to filter your traces based on a variety of conditions. While the OR keyword is not supported, the search functionality is powerful enough to handle complex queries for trace discovery and analysis.
Search Traces Overview
When working with MLflow tracing in production environments, you'll often have thousands of traces across different experiments representing various model inferences, LLM calls, or ML pipeline executions. The search_traces API helps you find specific traces based on their execution characteristics, metadata, tags, and other attributes - making trace analysis and debugging much more efficient.
Search Query Syntax
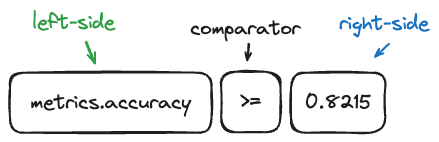
The search_traces API uses a SQL-like Domain Specific Language (DSL) for querying traces.
Visual Representation of Search Components:
Key Features:
- Supported Attributes:
request_id,timestamp_ms,execution_time_ms,status,name,run_id - Tag Support: Use
tags.ortag.prefix to filter by trace tags - Metadata Support: Use
metadata.prefix to filter by request metadata - Timestamp Filtering: Built-in support for time-based queries
- Status Filtering: Filter by trace execution status (OK, ERROR, IN_PROGRESS)
Syntax Rules:
Field Syntax:
- Attributes:
status,timestamp_ms,execution_time_ms,trace.name - Tags:
tags.operation_type,tag.model_name(both prefixes supported) - Metadata:
metadata.run_id - Use backticks for special characters:
tags.`model-name`
Value Syntax:
- String values must be quoted:
status = 'OK' - Numeric values don't need quotes:
execution_time_ms > 1000 - Tag and metadata values must be quoted as strings
Supported Comparators:
- Numeric (
timestamp_ms,execution_time_ms):>,>=,=,!=,<,<= - String (
name,status,request_id):=,!=,IN,NOT IN - Tags/Metadata:
=,!=
Trace Status Values:
OK- Successful executionERROR- Failed executionIN_PROGRESS- Currently executing
Example Queries
Filter by Name
# Search for traces by name
mlflow.search_traces(filter_string="trace.name = 'predict'")
mlflow.search_traces(filter_string="name = 'llm_inference'")
Filter by Status
# Get successful traces
mlflow.search_traces(filter_string="trace.status = 'OK'")
mlflow.search_traces(filter_string="status = 'OK'")

# Get failed traces
mlflow.search_traces(filter_string="status = 'ERROR'")

# Multiple statuses
mlflow.search_traces(filter_string="status IN ('OK', 'ERROR')")
Filter by Execution Time
# Find slow traces (> 1 second)
mlflow.search_traces(filter_string="execution_time_ms > 1000")

# Performance range
mlflow.search_traces(
    filter_string="execution_time_ms >= 200 AND execution_time_ms <= 800"
)
Filter by Timestamp
import time

# Get traces from last hour
timestamp = int(time.time() * 1000)
mlflow.search_traces(filter_string=f"trace.timestamp > {timestamp - 3600000}")

# Alternative syntax
mlflow.search_traces(filter_string=f"timestamp_ms > {timestamp - 3600000}")
Filter by Tags
# Filter by tag values (both syntaxes supported)
mlflow.search_traces(filter_string="tag.model_name = 'gpt-4'")
mlflow.search_traces(filter_string="tags.operation_type = 'llm_inference'")
Filter by Run Association
# Find traces associated with a specific run
mlflow.search_traces(run_id="run_id_123456")

# Or using filter string
mlflow.search_traces(filter_string="metadata.run_id = 'run_id_123456'")
Combine Multiple Conditions
# Complex query
mlflow.search_traces(filter_string="trace.status = 'OK' AND tag.importance = 'high'")

# Production error analysis
mlflow.search_traces(
    filter_string="""
        tags.environment = 'production'
        AND status = 'ERROR'
        AND execution_time_ms > 500
    """
)
Filtering Traces in the UI
Use the search box in the MLflow Trace UI to filter traces by various criteria using the same syntax described above.
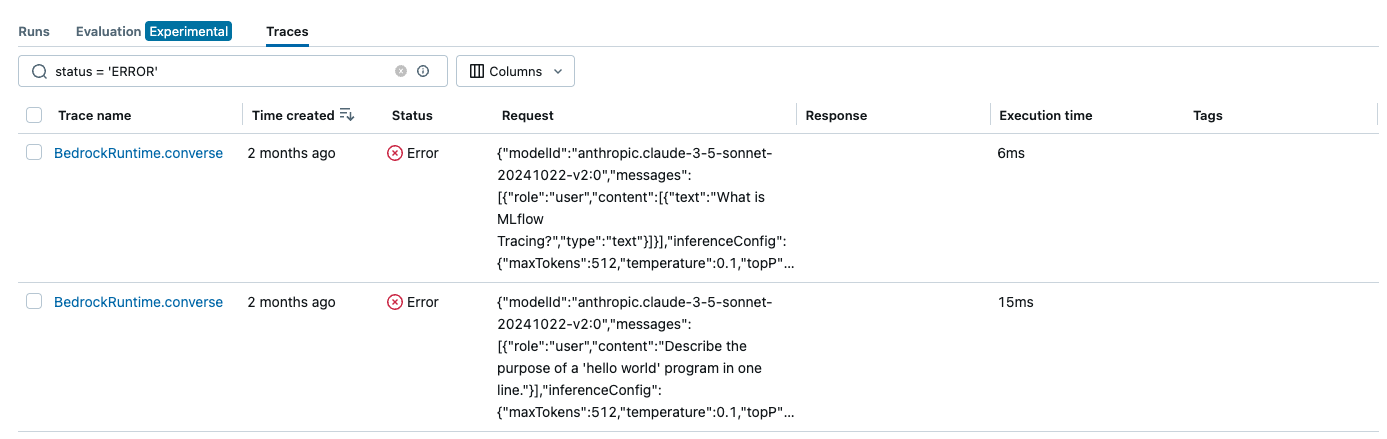
The UI search supports all the same filter syntax as the API, allowing you to:
- Filter by trace name, status, or execution time
- Search by tags and metadata
- Use timestamp ranges
- Combine multiple conditions with AND
Programmatic Search with Python
mlflow.search_traces() provides convenient trace search functionality:
import mlflow

# Basic search with default DataFrame output
traces_df = mlflow.search_traces(filter_string="status = 'OK'")

# Return as list of Trace objects
traces_list = mlflow.search_traces(filter_string="status = 'OK'", return_type="list")
The return_type parameter is available in MLflow 2.21.1+. For older versions, use mlflow.client.MlflowClient.search_traces() for list output.
Return Format
1. DataFrame
The search_traces API returns a pandas DataFrame by default with the following columns:
- MLflow 3.x
- MLflow 2.x
trace_id- Primary identifiertrace- Trace objectclient_request_id- Client request IDstate- Trace state (OK, ERROR, IN_PROGRESS, STATE_UNSPECIFIED)request_time- Start time in millisecondsexecution_duration- Duration in millisecondsinputs- Input to traced logicoutputs- Output of traced logicexpectations- A dictionary of ground truth labels annotated on the tracetrace_metadata- Key-value metadatatags- Associated tagsassessments- List of assessment objects attached on the trace
request_id- Primary identifiertrace- Trace objecttimestamp_ms- Start time in millisecondsstatus- Trace statusexecution_time_ms- Duration in millisecondsrequest- Input to traced logicresponse- Output of traced logicrequest_metadata- Key-value metadataspans- Spans in tracetags- Associated tags
2. List of Trace Objects
Alternatively, you can specify return_type="list" to get a list of mlflow.entities.Trace() objects instead of a DataFrame.
traces = mlflow.search_traces(filter_string="status = 'OK'", return_type="list")
# list[mlflow.entities.Trace]
Ordering Results
MLflow supports ordering results by the following keys:
timestamp_ms(default: DESC) - Trace start timeexecution_time_ms- Trace durationstatus- Trace execution statusrequest_id- Trace identifier
# Order by timestamp (most recent first)
traces = mlflow.search_traces(order_by=["timestamp_ms DESC"])

# Multiple ordering criteria
traces = mlflow.search_traces(order_by=["timestamp_ms DESC", "status ASC"])
Extract Span Fields
Extract specific span data into DataFrame columns:
traces = mlflow.search_traces(
    extract_fields=[
        "morning_greeting.inputs.name",  # Extract specific input
        "morning_greeting.outputs",  # Extract all outputs
    ],
)

# Creates additional columns:
# - morning_greeting.inputs.name
# - morning_greeting.outputs
This is useful for creating evaluation datasets:
eval_data = traces.rename(
    columns={
        "morning_greeting.inputs.name": "inputs",
        "morning_greeting.outputs": "ground_truth",
    }
)

results = mlflow.genai.evaluate(data=eval_data, scorers=[...])
extract_fields only works with return_type="pandas".
Pagination
mlflow.client.MlflowClient.search_traces() supports pagination:
from mlflow import MlflowClient

client = MlflowClient()
page_token = None
all_traces = []

while True:
    results = client.search_traces(
        experiment_ids=["1"],
        filter_string="status = 'OK'",
        max_results=100,
        page_token=page_token,
    )

    all_traces.extend(results)

    if not results.token:
        break
    page_token = results.token

print(f"Found {len(all_traces)} total traces")
Common Use Cases
Performance Analysis
# Find slowest 10 traces
slowest_traces = mlflow.search_traces(
    filter_string="status = 'OK'",
    order_by=["execution_time_ms DESC"],
    max_results=10,
)

# Performance threshold violations
slow_production = mlflow.search_traces(
    filter_string="""
        tags.environment = 'production'
        AND execution_time_ms > 2000
        AND status = 'OK'
    """,
)
Error Analysis
import time

# Recent errors
yesterday = int((time.time() - 24 * 3600) * 1000)
error_traces = mlflow.search_traces(
    filter_string=f"status = 'ERROR' AND timestamp_ms > {yesterday}",
    order_by=["timestamp_ms DESC"],
)

# Analyze error patterns
error_by_operation = {}
for _, trace in error_traces.iterrows():
    # Access tags from the trace object
    tags = trace["tags"] if "tags" in trace else {}
    op_type = tags.get("operation_type", "unknown")
    error_by_operation[op_type] = error_by_operation.get(op_type, 0) + 1
Model Performance Comparison
# Compare performance across models
models = ["gpt-4", "bert-base", "roberta-large"]
model_stats = {}

for model in models:
    traces = mlflow.search_traces(
        filter_string=f"tags.model_name = '{model}' AND status = 'OK'",
        return_type="list",
    )

    if traces:
        exec_times = [trace.info.execution_time_ms for trace in traces]
        model_stats[model] = {
            "count": len(traces),
            "avg_time": sum(exec_times) / len(exec_times),
            "max_time": max(exec_times),
        }

print("Model performance comparison:")
for model, stats in model_stats.items():
    print(f"{model}: {stats['count']} traces, avg {stats['avg_time']:.1f}ms")
Creating Evaluation Datasets
# Extract LLM conversation data for evaluation
conversation_data = mlflow.search_traces(
    filter_string="tags.task_type = 'conversation' AND status = 'OK'",
    extract_fields=["llm_call.inputs.prompt", "llm_call.outputs.response"],
)

# Rename for evaluation
eval_dataset = conversation_data.rename(
    columns={
        "llm_call.inputs.prompt": "inputs",
        "llm_call.outputs.response": "ground_truth",
    }
)

# Use with MLflow evaluate
results = mlflow.genai.evaluate(data=eval_dataset, scorers=[...])
Environment Monitoring
# Monitor error rates across environments
environments = ["production", "staging", "development"]

for env in environments:
    total = mlflow.search_traces(filter_string=f"tags.environment = '{env}'")

    errors = mlflow.search_traces(
        filter_string=f"tags.environment = '{env}' AND status = 'ERROR'",
    )

    error_rate = len(errors) / len(total) * 100 if len(total) > 0 else 0
    print(f"{env}: {error_rate:.1f}% error rate ({len(errors)}/{len(total)})")
Create Example Traces
Create sample traces to explore the search functionality:
import time
import mlflow
from mlflow.entities import SpanType


# Define methods to be traced
@mlflow.trace(span_type=SpanType.TOOL, attributes={"time": "morning"})
def morning_greeting(name: str):
    time.sleep(1)
    mlflow.update_current_trace(tags={"person": name})
    return f"Good morning {name}."


@mlflow.trace(span_type=SpanType.TOOL, attributes={"time": "evening"})
def evening_greeting(name: str):
    time.sleep(1)
    mlflow.update_current_trace(tags={"person": name})
    return f"Good evening {name}."


@mlflow.trace(span_type=SpanType.TOOL)
def goodbye():
    raise Exception("Cannot say goodbye")


# Execute within different experiments
morning_experiment = mlflow.set_experiment("Morning Experiment")
morning_greeting("Tom")

# Get timestamp for filtering
morning_time = int(time.time() * 1000)

evening_experiment = mlflow.set_experiment("Evening Experiment")
evening_greeting("Mary")
try:
    goodbye()
except:
    pass  # This creates an ERROR trace

print("Created example traces with different statuses and timing")
Alternative Setup - Production-Like Traces
import mlflow
import time
import random
from mlflow import trace

mlflow.set_experiment("trace-search-guide")

# Configuration for realistic traces
operation_types = ["llm_inference", "embedding_generation", "text_classification"]
model_names = ["gpt-4", "bert-base", "roberta-large"]
environments = ["production", "staging", "development"]


def simulate_operation(op_type, model_name, duration_ms):
    """Simulate an AI/ML operation"""
    time.sleep(duration_ms / 1000.0)

    # Simulate occasional errors
    if random.random() < 0.1:
        raise Exception(f"Simulated error in {op_type}")

    return f"Completed {op_type} with {model_name}"


# Create diverse traces
for i in range(20):
    op_type = random.choice(operation_types)
    model_name = random.choice(model_names)
    environment = random.choice(environments)
    duration = random.randint(50, 2000)  # 50ms to 2s

    try:
        with mlflow.start_run():
            mlflow.set_tag("environment", environment)

            with trace(
                name=f"{op_type}_{i}",
                attributes={
                    "operation_type": op_type,
                    "model_name": model_name,
                    "environment": environment,
                    "input_tokens": str(random.randint(10, 500)),
                },
            ) as span:
                result = simulate_operation(op_type, model_name, duration)
                span.set_attribute("result", result)

    except Exception:
        # Creates ERROR status traces
        continue

print("Created 20 example traces with various characteristics")
Start MLflow UI to explore:
mlflow ui
Visit http://localhost:5000/ to see your traces in the UI.
With these traces created, you can experiment with searching within the UI or programmatically via either the fluent or client search_traces APIs.
Important Notes
MLflow Version Compatibility
DataFrame Schema: The format depends on the MLflow version used to call the search_traces API, not the version used to log the traces. MLflow 3.x uses different column names than 2.x.
Return Type Support:
- MLflow 2.21.1+:
return_typeparameter available inmlflow.search_traces() - Earlier versions: Use
MlflowClient.search_traces()for list output
Performance Tips
- Use timestamp filters to limit search space
- Limit max_results for faster queries when ordering
- Use pagination for large result sets
- Index frequently queried tags in your storage system
Backend Considerations
- Database Backend: Optimized performance with proper indexing on timestamp and status
- Databricks: Enhanced performance with
sql_warehouse_idparameter - Local File Store: May be slower with large datasets. Not recommended, only suitable for storing small number of traces.
Summary
The search_traces API provides powerful trace discovery and analysis capabilities in MLflow. By combining flexible filtering, time-based queries, tag-based organization, and advanced features like span field extraction, you can efficiently investigate trace patterns, debug issues, and monitor system performance.
Key takeaways:
- Use SQL-like syntax with
tags./tag.,metadata., and direct attribute references - Filter by execution time, status, timestamps, and custom tags
- Combine multiple conditions with AND (OR is not supported)
- Use ordering and pagination for efficient data exploration
- Leverage span field extraction for evaluation dataset creation
- Choose appropriate return type based on your use case
Whether you're debugging production issues, analyzing model performance, monitoring system health, or creating evaluation datasets, mastering the trace search API will make your MLflow workflow more efficient and insightful.