Instrument your app
Learn how to instrument your GenAI application with MLflow Tracing to capture and visualize the execution flow of your application. MLflow offers two main approaches to implementing tracing that can be used independently or together for comprehensive observability.
Prerequisites
This guide requires the following packages:
mlflow>=3.1: Core MLflow functionality with GenAI features.
openai>=1.0.0: Only required to run the Quick Start Examples below (if using other LLM providers, install their respective SDKs instead)
Install the required packages:
pip install --upgrade "mlflow>=3.1" openai>=1.0.0
While tracing features are available starting in MLflow 2.15.0+, it is strongly recommended to install MLflow 3 for the latest GenAI capabilities, including expanded tracing features, enhanced evaluation capabilities, and an improved UI.
Environment Setup
Before running the examples below, configure your environment:
- Local MLflow
- Remote Server
- Databricks
For local development, start the MLflow tracking server:
mlflow server --host 127.0.0.1 --port 5000
Then configure your tracking URI:
import mlflow

mlflow.set_tracking_uri("http://127.0.0.1:5000")
mlflow.set_experiment("my-tracing-experiment")
For remote MLflow servers, configure the tracking URI:
import mlflow

mlflow.set_tracking_uri("https://your-mlflow-server.com")
mlflow.set_experiment("my-tracing-experiment")
If you're working on tracing with Databricks, configure your authentication:
import os

# Set Databricks authentication (only needed when running outside Databricks)
os.environ["DATABRICKS_HOST"] = "https://your-workspace.databricks.com"
os.environ["DATABRICKS_TOKEN"] = "your-databricks-token"
Tracing Approaches
MLflow provides two complementary approaches to tracing:
Automatic Tracing: Just add 1 line of code mlflow.<library>.autolog() to automatically capture your app's logic. Automatic tracing works with 20+ supported libraries and frameworks out of the box
Manual Tracing: Designed for custom logic and complex workflows, manual tracing gives you full control over what gets traced and how using high-level APIs (decorators and fluent context managers) or low-level APIs.
Automatic and manual tracing can be used together. For example, you could use the auto-tracing for OpenAI's SDK and manual tracing to combine multiple LLM calls into a single trace that represents your application's end to end logic.
Quick Start Examples
Automatic Tracing Example
Enable automatic tracing for your favorite library with just one line of code:
import mlflow
from openai import OpenAI
import os

# Set up environment (if not already configured)
os.environ["OPENAI_API_KEY"] = "your-api-key-here"

# Set up MLflow tracking
mlflow.set_tracking_uri("http://127.0.0.1:5000")
mlflow.set_experiment("auto-tracing-demo")

# Enable automatic tracing for OpenAI
mlflow.openai.autolog()

# Your existing code works unchanged
client = OpenAI()
response = client.chat.completions.create(
    model="gpt-4o-mini",
    messages=[{"role": "user", "content": "What is MLflow?"}],
    max_tokens=100,
)

print(response.choices[0].message.content)
# Traces are automatically captured and logged!
Manual Tracing Example
Use the @mlflow.trace decorator to instrument your custom functions:
import mlflow
from mlflow.entities import SpanType
from openai import OpenAI
import os

# Set up environment (if not already configured)
os.environ["OPENAI_API_KEY"] = "your-api-key-here"

# Set up MLflow tracking
mlflow.set_tracking_uri("http://127.0.0.1:5000")
mlflow.set_experiment("manual-tracing-demo")

# Enable automatic tracing for OpenAI
mlflow.openai.autolog()


@mlflow.trace(name="RAG Pipeline", span_type=SpanType.CHAIN)
def answer_question(question: str) -> str:
    """A simple RAG pipeline with manual tracing."""

    # Step 1: Retrieve context (manually traced)
    context = retrieve_context(question)

    # Step 2: Generate answer (automatically traced by OpenAI autolog)
    client = OpenAI()
    response = client.chat.completions.create(
        model="gpt-4o-mini",
        messages=[
            {"role": "system", "content": f"Context: {context}"},
            {"role": "user", "content": question},
        ],
        max_tokens=150,
    )

    return response.choices[0].message.content


@mlflow.trace(span_type=SpanType.RETRIEVER)
def retrieve_context(question: str) -> str:
    """Simulate context retrieval."""
    # Simulate retrieval logic
    return f"Relevant context for: {question}"


# Execute the traced pipeline
result = answer_question("What is MLflow Tracing?")
print(result)
Generally, we recommend starting with automatic tracing and only moving to manual tracing if your application's logic is not accurately captured or you need more control.
Automatic Tracing
Automatic tracing provides zero-code observability for supported libraries. Simply call the autolog function for your library and MLflow will automatically capture all relevant operations.
MLflow supports automatic tracing for 20+ popular GenAI libraries including LLM providers (OpenAI, Anthropic, Google Gemini, AWS Bedrock), frameworks (LangChain, LangGraph, LlamaIndex, DSPy). See the complete list at Automatic Tracing Integrations.
import mlflow

mlflow.openai.autolog()
You can enable autolog for multiple libraries simultaneously by calling each autolog function. For example, to enable autolog for OpenAI and LangChain, you can do:
import mlflow

mlflow.openai.autolog()
mlflow.langchain.autolog()
Manual Tracing
Manual tracing gives you fine-grained control over what gets traced and how. Use it to instrument custom logic, combine operations into logical units, or add custom metadata.
- @mlflow.trace Decorator
- Context Manager
- Combining with Auto Tracing
The decorator approach is ideal for instrumenting functions:
import mlflow
from mlflow.entities import SpanType


@mlflow.trace(name="Document Processor", span_type=SpanType.CHAIN)
def process_document(document: str, language: str = "en") -> dict:
    """Process a document through multiple steps."""

    # This entire function execution will be traced
    tokens = tokenize(document)
    entities = extract_entities(tokens, language)
    summary = generate_summary(tokens)

    return {"entities": entities, "summary": summary, "token_count": len(tokens)}
Use context managers for instrumenting code blocks:
import mlflow
from mlflow.entities import SpanType


def complex_pipeline(data):
    with mlflow.start_span(name="Data Validation", span_type=SpanType.UNKNOWN) as span:
        validated_data = validate_input(data)
        span.set_attribute("validation_errors", len(validated_data.errors))

    with mlflow.start_span(name="Model Prediction", span_type=SpanType.LLM) as span:
        prediction = model.predict(validated_data)
        span.set_attribute("confidence", prediction.confidence)

    return prediction
The most powerful approach combines both automatic and manual tracing:
import mlflow
from mlflow.entities import SpanType
from openai import OpenAI

# Enable automatic tracing for OpenAI
mlflow.openai.autolog()


@mlflow.trace(name="RAG Pipeline", span_type=SpanType.CHAIN)
def rag_pipeline(question: str) -> str:
    """A RAG pipeline with both manual and automatic tracing."""

    # Manual tracing for custom retrieval logic
    with mlflow.start_span(
        name="Document Retrieval", span_type=SpanType.RETRIEVER
    ) as span:
        relevant_docs = search_documents(question)
        span.set_attribute("documents_retrieved", len(relevant_docs))

    # Automatic tracing for OpenAI call (via autolog)
    client = OpenAI()
    response = client.chat.completions.create(
        model="gpt-4o-mini",
        messages=[
            {"role": "system", "content": f"Context: {relevant_docs}"},
            {"role": "user", "content": question},
        ],
    )

    return response.choices[0].message.content
Span Types and Attributes
Enhance your traces with proper categorization and metadata using span types like SpanType.CHAIN, SpanType.LLM, SpanType.RETRIEVER, SpanType.EMBEDDING, and others. Add custom attributes using span.set_attribute() to capture important metadata about your operations.
Learn more about manual tracing techniques, decorators, context managers, and advanced patterns in the Manual Tracing Guide.
View Logged Traces
After instrumenting your application, you can view and analyze your traces in several ways:
- MLflow UI
- Jupyter Notebooks
- Programmatic Access
After logging your traces, you can view them in the MLflow UI, under the "Traces" tab in the main experiment page. This tab is also available within the individual run pages, if your trace was logged within a run context.
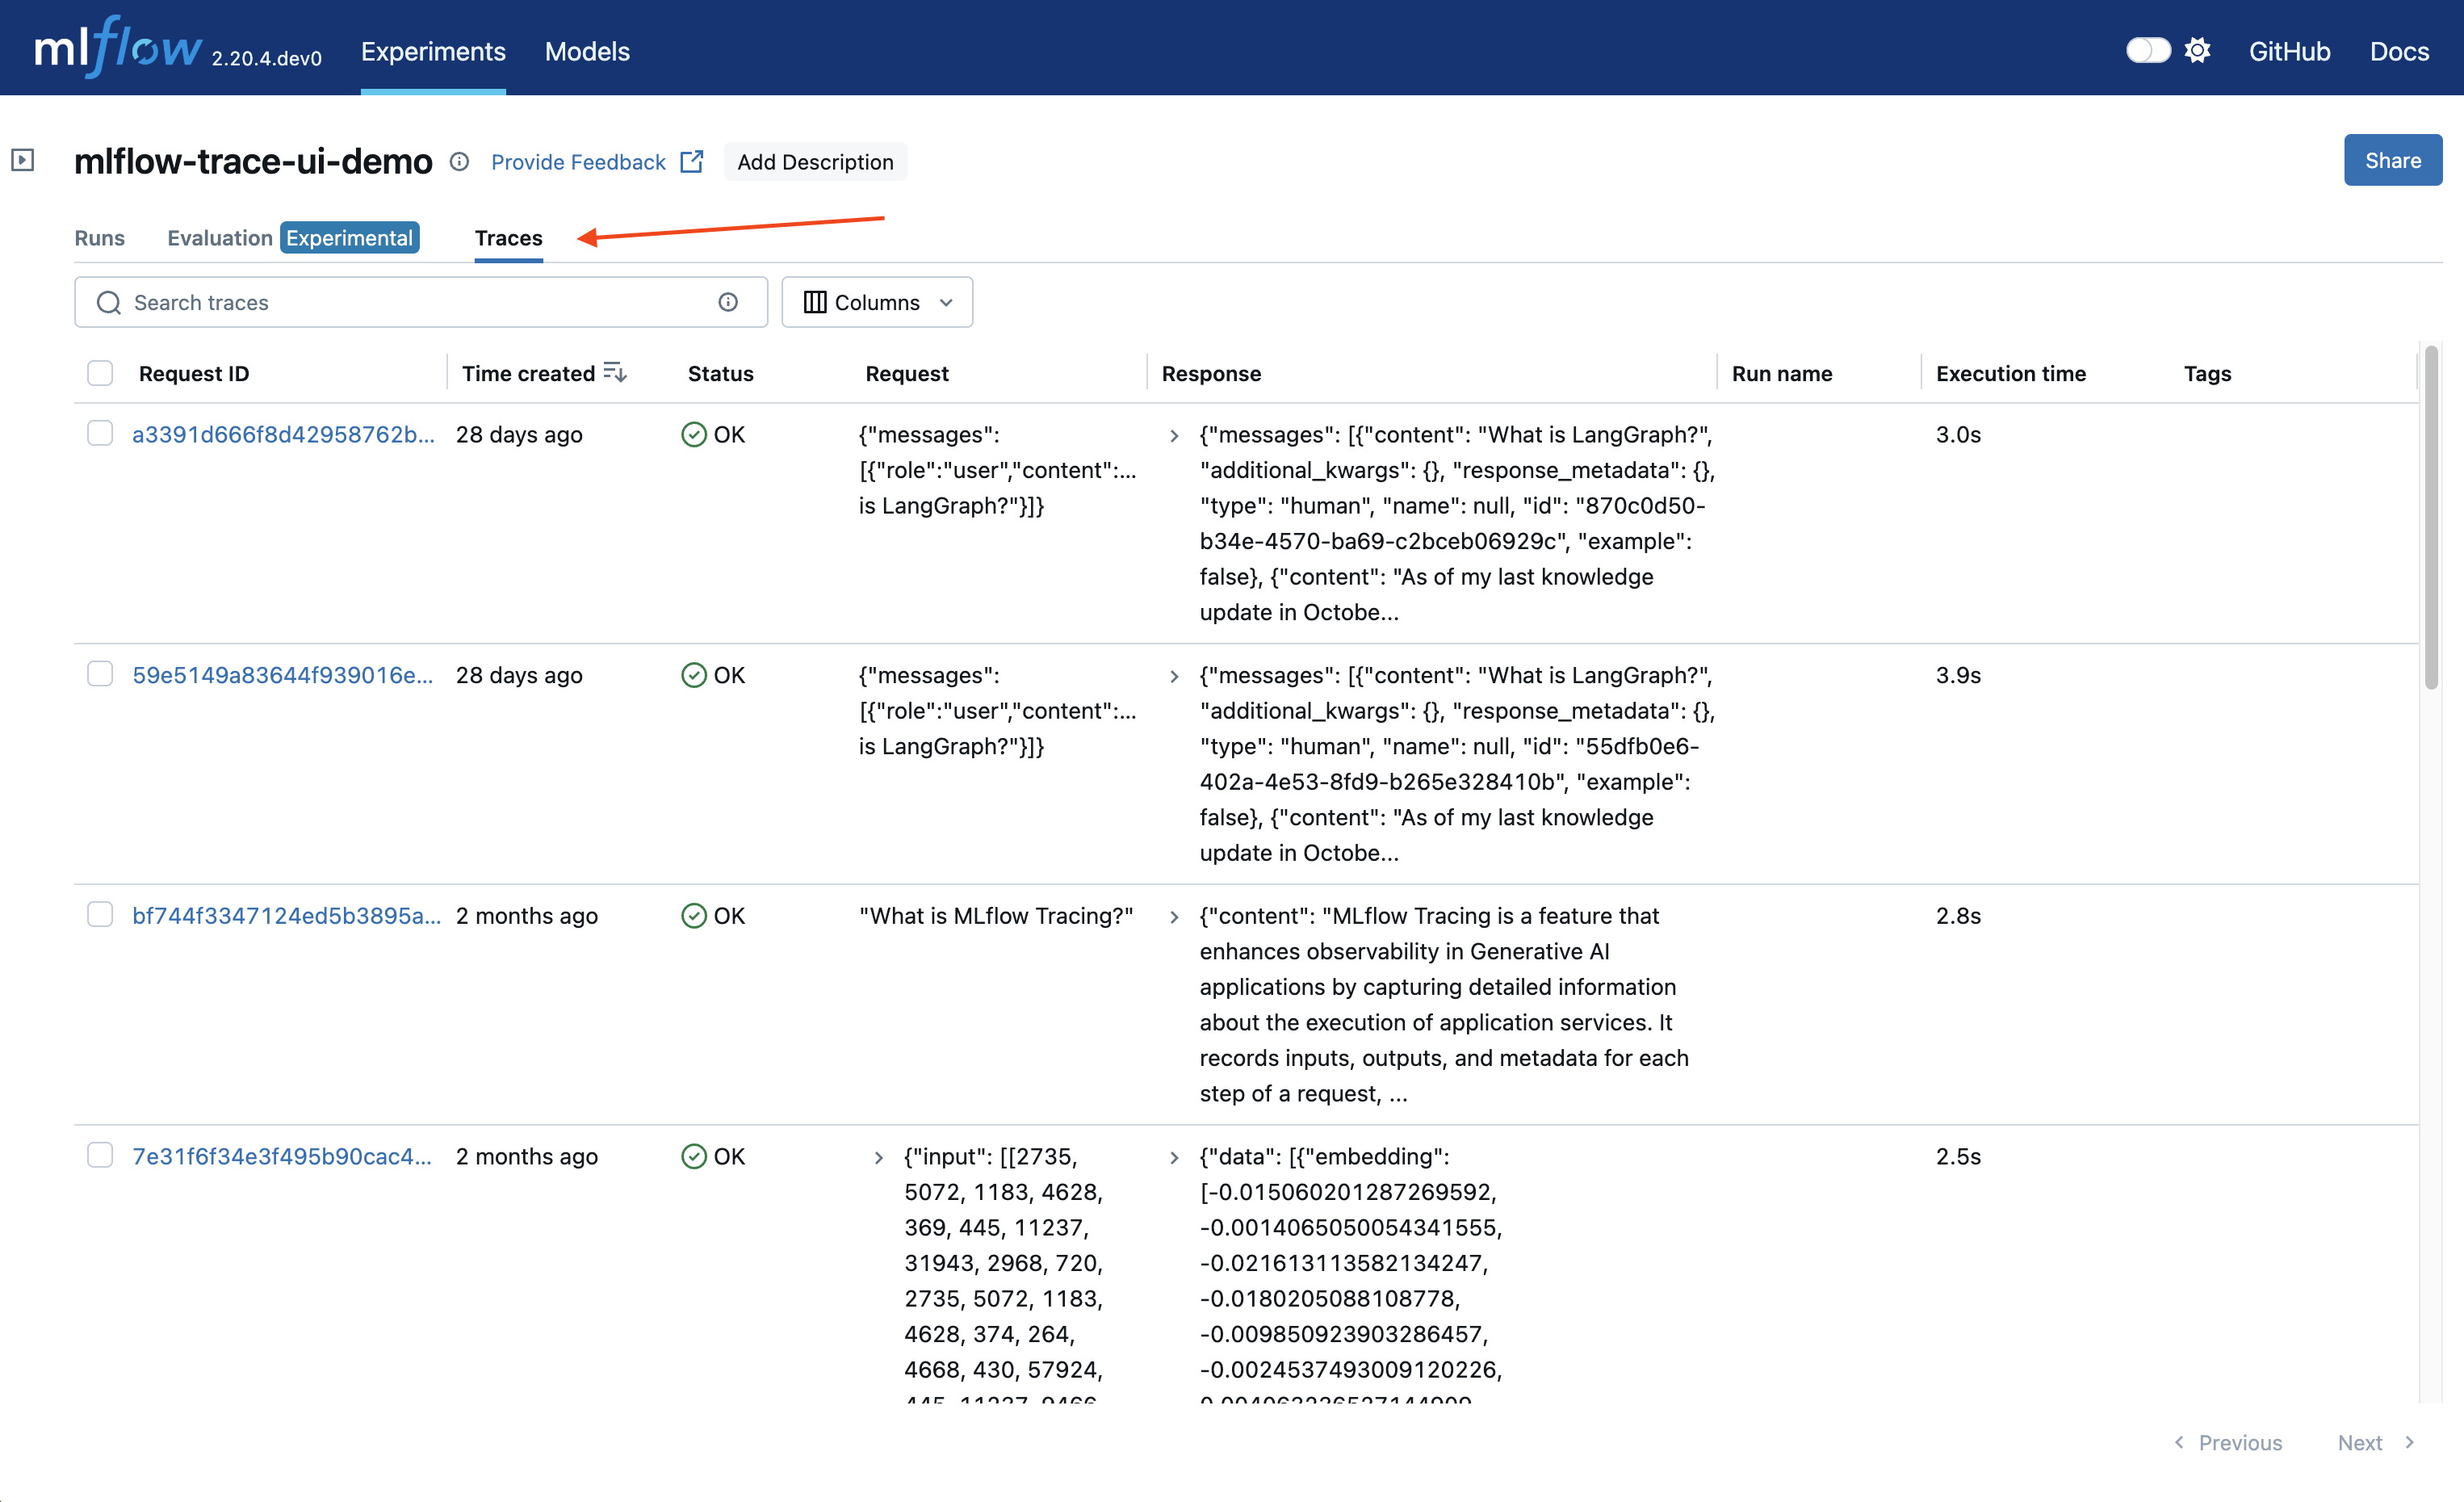
This table includes high-level information about the traces, such as the trace ID, the inputs / outputs of the root span, and more. From this page, you can also perform a few actions to manage your traces:
Search: Using the search bar in the UI, you can easily filter your traces based on name, tags, or other metadata. Check out the search docs for details about the query string format.
Delete: The UI supports bulk deletion of traces. Simply select the traces you want to delete by checking the checkboxes, and then pressing the "Delete" button.
Edit Tags: You can also edit key-value tags on your traces via the UI.
To browse the span data of an individual trace, simply click on the link in the "Trace ID" or "Trace name" columns to open the trace viewer:
The MLflow Tracing Jupyter integration is available in MLflow 2.20 and above
You can also view the trace UI directly within Jupyter notebooks, allowing you to debug your applications without having to tab out of your development environment.

This feature requires using an MLflow Tracking Server, as this is where the UI assets are fetched from. To get started, simply ensure that the MLflow Tracking URI is set to your tracking server (e.g. mlflow.set_tracking_uri("http://localhost:5000")).
By default, the trace UI will automatically be displayed for the following events:
When the cell code generates a trace (e.g. via automatic tracing, or by running a manually traced function)
When mlflow.search_traces() is called
When a mlflow.entities.Trace() object is displayed (e.g. via IPython's display function, or when it is the last value returned in a cell)
To disable the display, simply call mlflow.tracing.disable_notebook_display(), and rerun the cell containing the UI. To enable it again, call mlflow.tracing.enable_notebook_display().
Query and analyze traces programmatically:
import mlflow

# Search for traces with specific criteria
traces = mlflow.search_traces(
    experiment_ids=["1"],
    filter_string="attributes.model_name = 'gpt-4o-mini'",
    max_results=100,
)

# Get a specific trace
trace = mlflow.get_trace("trace-id-here")
Next Steps
Now that you understand the basics of instrumenting your app with MLflow Tracing, explore these detailed guides and resources:
- Learn More
- Integration Examples
- Working with Traces
Deepen Your Tracing Knowledge:
Automatic Tracing: Explore all supported libraries and frameworks for one-line tracing integration
Manual Tracing: Learn advanced techniques for custom instrumentation and complex workflows
Combining Approaches: Mix automatic and manual tracing for optimal observability
Library-Specific Guides:
OpenAI Integration: Detailed OpenAI tracing examples and best practices
LangChain Integration: Comprehensive LangChain application tracing
LlamaIndex Integration: Trace LlamaIndex workflows and components
All Integrations: Browse all supported libraries and frameworks
Analyze and Use Your Trace Data:
Query Traces: Programmatically access and analyze your traces
Search and Filter: Advanced search techniques and filtering options
Production Monitoring: Scale tracing for production workloads
Recommended Learning Path:
Start with automatic tracing for immediate value, then add manual tracing for custom logic and workflows. The combination of automatic and manual tracing gives you comprehensive observability into your GenAI applications with minimal overhead.