MLflow Tracing UI
Traces within MLflow Experiments
After logging your traces, you can view them in the MLflow UI, under the "Traces" tab in the main experiment page. This tab is also available within the individual run pages, if your trace was logged within a run context.
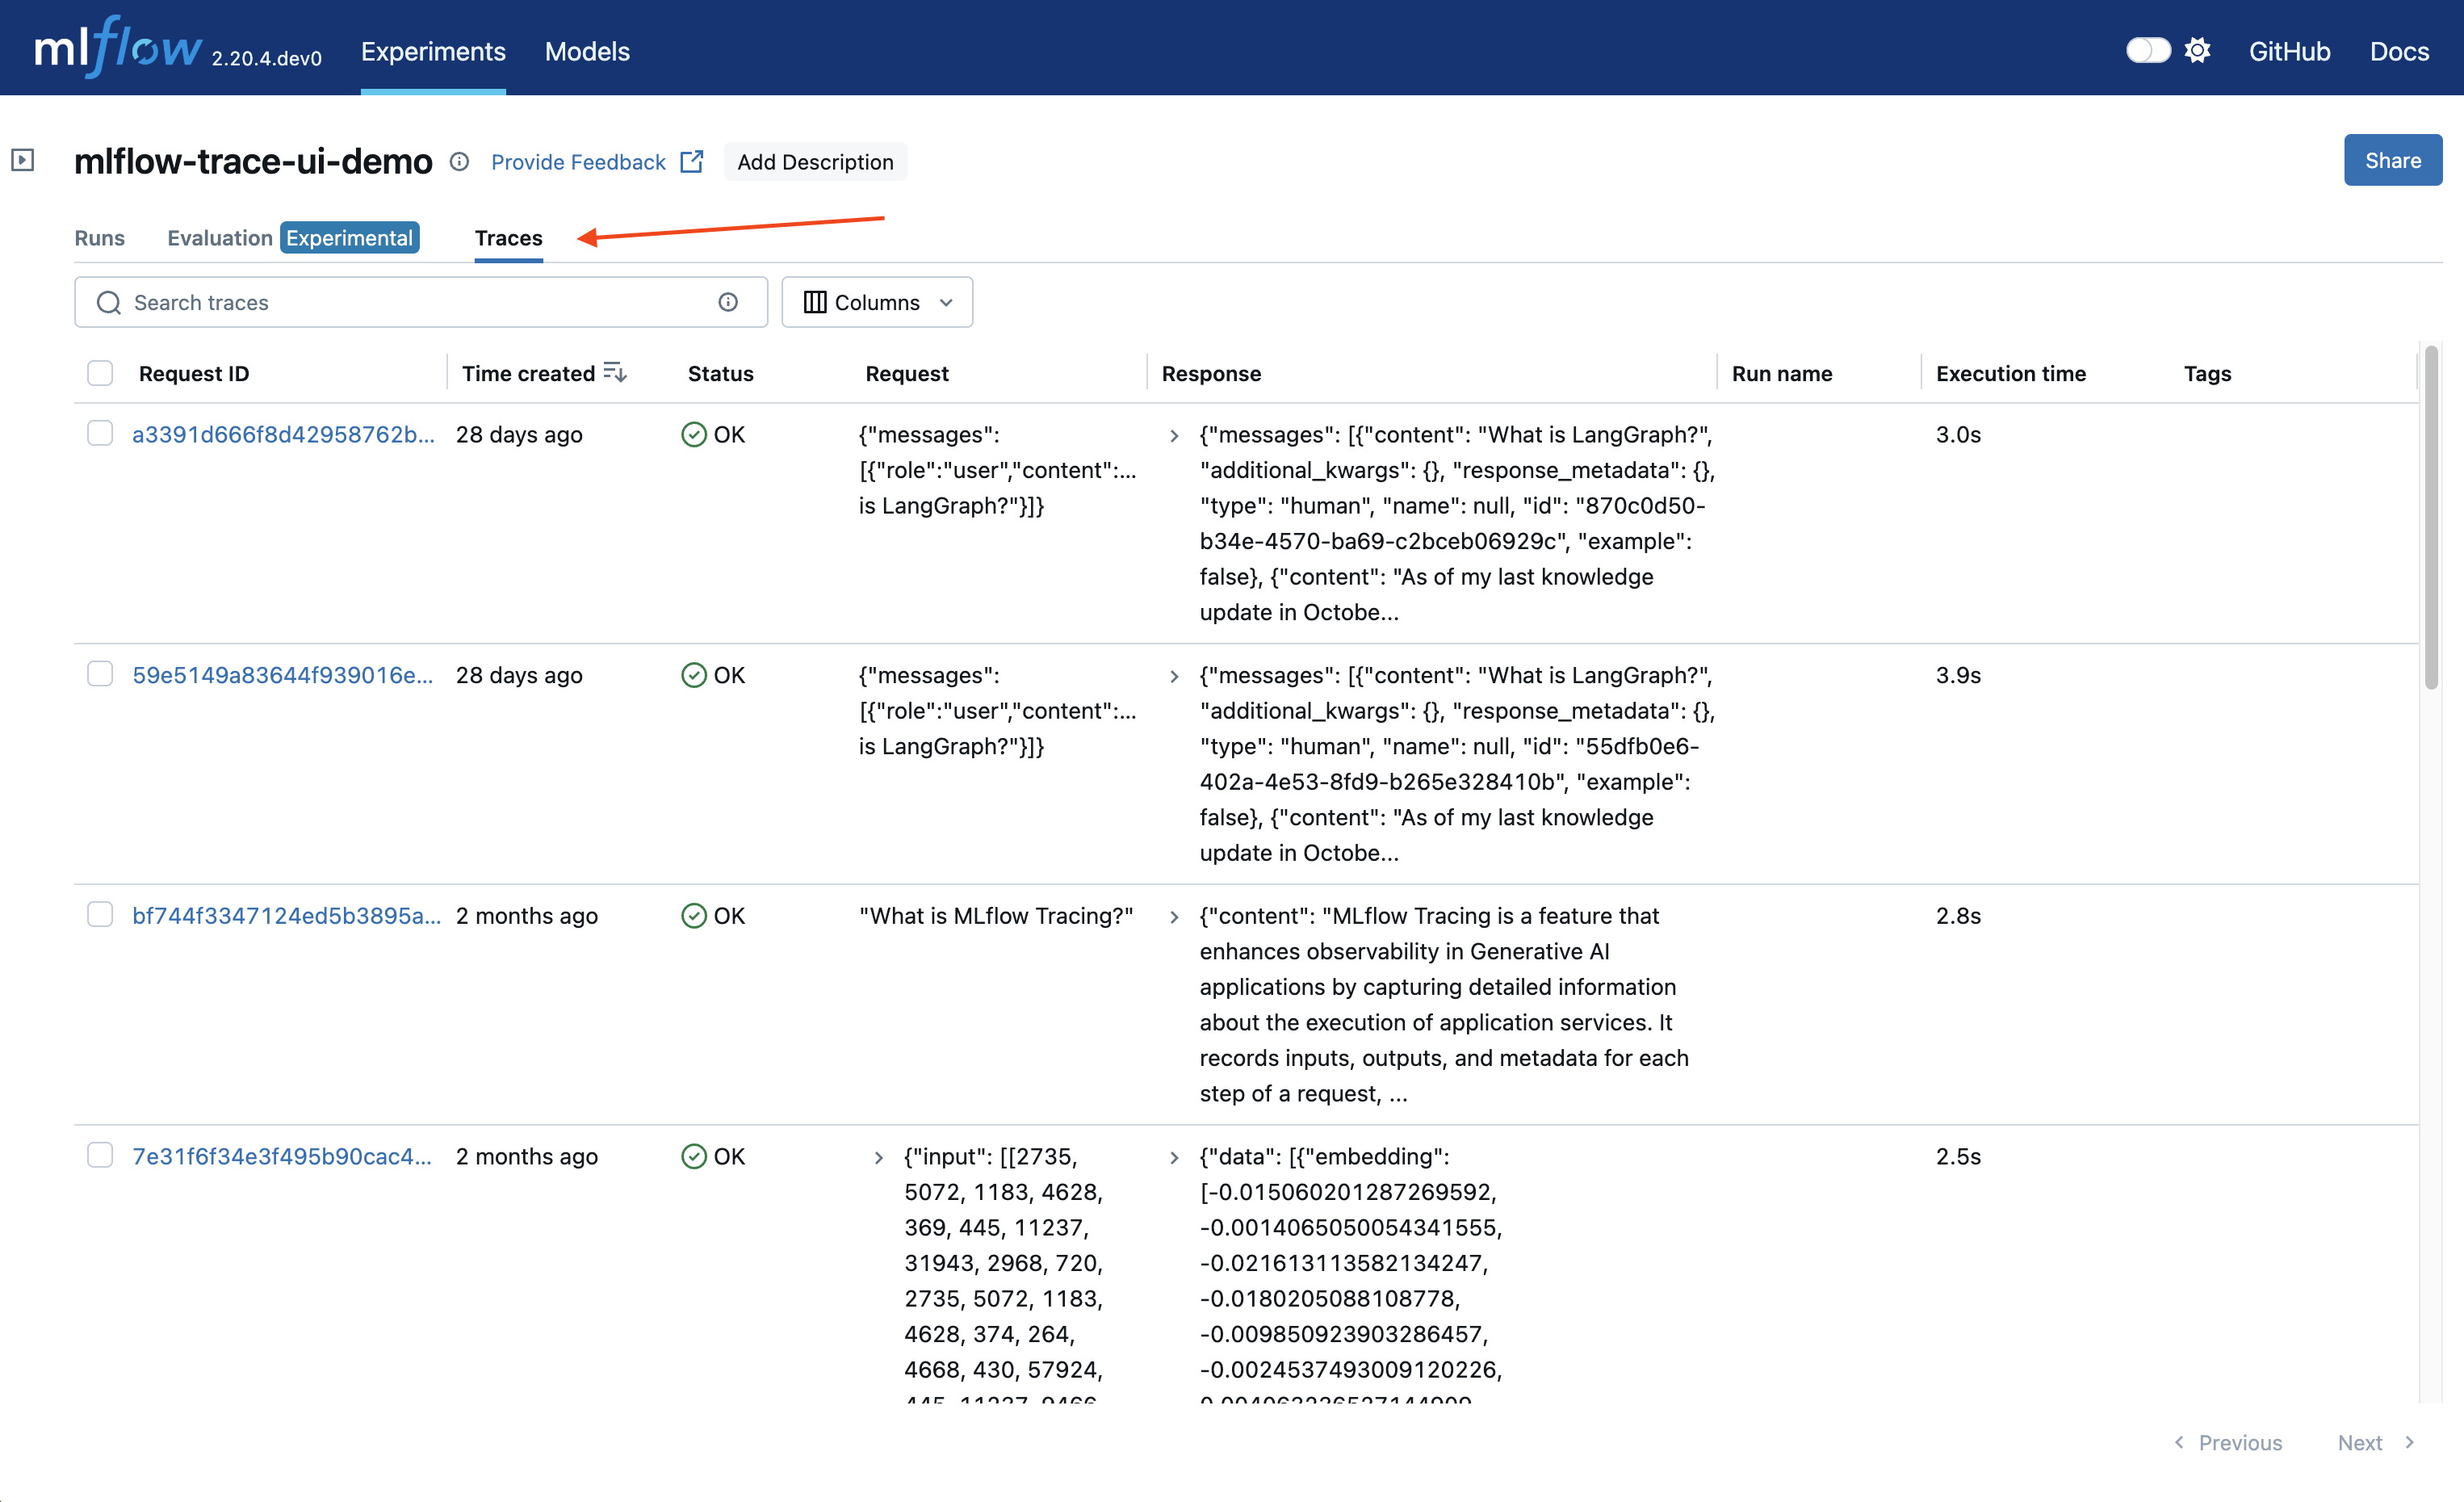
This table includes high-level information about the traces, such as the trace ID, the inputs / outputs of the root span, and more. From this page, you can also perform a few actions to manage your traces:
- Search
- Delete
- Edit Tags
Using the search bar in the UI, you can easily filter your traces based on name, tags, or other metadata. Check out the search docs for details about the query string format.
The UI supports bulk deletion of traces. Simply select the traces you want to delete by checking the checkboxes, and then pressing the "Delete" button.
You can also edit key-value tags on your traces via the UI.
Browsing span data
In order to browse the span data of an individual trace, simply click on the link in the "Trace ID" or "Trace name" columns to open the trace viewer:
Jupyter Notebook integration
The MLflow Tracing Jupyter integration is available in MLflow 2.20 and above
You can also view the trace UI directly within Jupyter notebooks, allowing you to debug your applications without having to tab out of your development environment.

This feature requires using an MLflow Tracking Server, as
this is where the UI assets are fetched from. To get started, simply ensure that the MLflow
Tracking URI is set to your tracking server (e.g. mlflow.set_tracking_uri("http://localhost:5000")).
By default, the trace UI will automatically be displayed for the following events:
- When the cell code generates a trace (e.g. via automatic tracing, or by running a manually traced function)
- When
mlflow.search_traces()is called - When a
mlflow.entities.Trace()object is displayed (e.g. via IPython'sdisplayfunction, or when it is the last value returned in a cell)
To disable the display, simply call mlflow.tracing.disable_notebook_display(), and rerun the cell
containing the UI. To enable it again, call mlflow.tracing.enable_notebook_display().
For a more complete example, try running this demo notebook!