Query Traces
This page describes how to query traces logged to MLflow in both UI and API.
- Filtering Traces on UI
- Filtering Traces on API
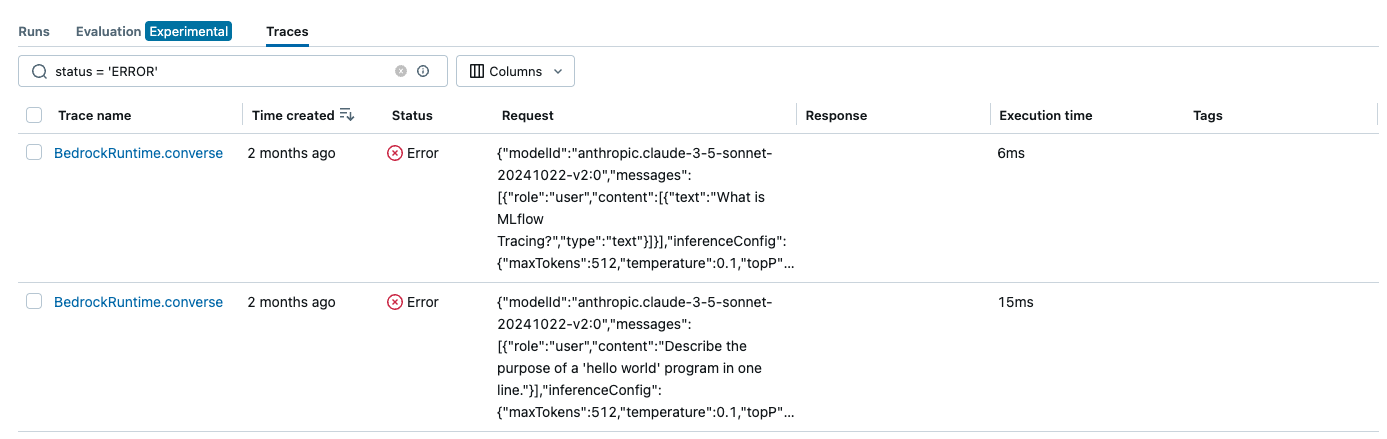
Use the search box in the MLflow Trace UI to filter traces by various criteria.
The mlflow.search_traces() API allows you to programmatically search for traces across experiments:
import mlflow

# Search traces in the current experiment
traces = mlflow.search_traces(filter_string="status = 'ERROR'")

# Search traces in specific experiments
traces = mlflow.search_traces(
    experiment_ids=["experiment_id_1", "experiment_id_2"],
    filter_string="name = 'predict'",
)
See the Filter Syntax section below for more details on filtering options.
Filter Syntax
The filter_string argument allows you to create powerful search queries using a SQL-like syntax. Here are the most common filter patterns:
Filter by Name
Search for traces by their name:
mlflow.search_traces(filter_string="trace.name = 'predict'")
Filter by Timestamp
Search traces created within a specific time range:
# Get traces created after a specific timestamp (in milliseconds)
timestamp = int(time.time() * 1000)
mlflow.search_traces(
    filter_string=f"trace.timestamp > {timestamp - 3600000}"  # Last hour
)
Filter by Status
Search for traces by their execution status:
# Get successful traces
mlflow.search_traces(filter_string="trace.status = 'OK'")

# Get failed traces
mlflow.search_traces(filter_string="trace.status = 'ERROR'")
Trace status must be one of ["OK", "ERROR", "IN_PROGRESS"].
Filter by Tags
Filter traces that have specific tag values:
mlflow.search_traces(filter_string="tag.model_name = 'gpt-4'")
Combine Multiple Conditions
Combine multiple filters using logical operators:
mlflow.search_traces(filter_string="trace.status = 'OK' AND tag.importance = 'high'")
Find Traces associated with an MLflow Run
- UI
- API
To view traces associated with a specific run:
- Navigate to the run details page
- Click on the "Traces" tab to see all traces associated with that run
Use the run_id parameter to search for traces associated with a specific run:
import mlflow

# Search traces associated with a specific run
traces = mlflow.search_traces(run_id="run_id_123456")
Searching Traces via API
This section provides a detailed guide on using the mlflow.search_traces() API for programmatic trace retrieval.
First, let's create some sample traces to demonstrate the search functionality:
import time
import mlflow
from mlflow.entities import SpanType


# Define methods to be traced
@mlflow.trace(span_type=SpanType.TOOL, attributes={"time": "morning"})
def morning_greeting(name: str):
    time.sleep(1)
    mlflow.update_current_trace(tags={"person": name})
    return f"Good morning {name}."


@mlflow.trace(span_type=SpanType.TOOL, attributes={"time": "evening"})
def evening_greeting(name: str):
    time.sleep(1)
    mlflow.update_current_trace(tags={"person": name})
    return f"Good evening {name}."


@mlflow.trace(span_type=SpanType.TOOL)
def goodbye():
    raise Exception("Cannot say goodbye")


# Execute the methods within different experiments
morning_experiment = mlflow.set_experiment("Morning Experiment")
morning_greeting("Tom")

# Get the timestamp in milliseconds
morning_time = int(time.time() * 1000)

evening_experiment = mlflow.set_experiment("Evening Experiment")
experiment_ids = [morning_experiment.experiment_id, evening_experiment.experiment_id]
evening_greeting("Mary")
goodbye()
Return Types
The mlflow.search_traces() API can return results in two formats, controlled by the return_type parameter:
# Default: Return as Pandas DataFrame
trace_df = mlflow.search_traces(experiment_ids=[morning_experiment.experiment_id])

# Return as list of Trace objects
trace_list = mlflow.search_traces(
    experiment_ids=[morning_experiment.experiment_id], return_type="list"
)
The return_type parameter is only available in MLflow version 2.21.1 and later. If you are using an older version, the mlflow.search_traces()
API will always return a Pandas DataFrame. To get a list of Trace objects, you can use the MlflowClient.search_traces() API instead.
DataFrame Schema
When using return_type="pandas" (default), MLflow returns the retrieved traces as a Pandas DataFrame. Each row represents a single trace. The DataFrame columns have changed between MLflow 2.x and 3.x.
- MLflow 3.x
- MLflow 2.x
- trace_id: A primary identifier of a trace
- trace: A trace object
- client_request_id: Client supplied request ID associated with the trace.
- state: State of the trace, can be one of [
OK,ERROR,IN_PROGRESS,STATE_UNSPECIFIED]. - request_time: The start time of the trace in milliseconds
- execution_duration: The duration of the trace in milliseconds
- request: The input to the traced logic
- response: The output of the traced logic
- trace_metadata: Key-value pairs associated with the trace
- spans: List of spans in the trace
- tags: List of assessments associated with the trace.
- request_id: A primary identifier of a trace
- trace: A trace object
- timestamp_ms: The start time of the trace in milliseconds
- status: The status of the trace
- execution_time_ms: The duration of the trace in milliseconds
- request: The input to the traced logic
- response: The output of the traced logic
- request_metadata: Key-value pairs associated with the trace
- spans: Spans in the trace
- tags: Tags associated with the trace
The format of the DataFrame depends on the MLflow version used to call the search_traces API,
not the version used for logging the traces. For example, if you log traces using MLflow 2.x
and then query them using MLflow 3.x, the DataFrame will be returned in the MLflow 3.x schema.
Order Traces
You can order the search results using the order_by parameter:
mlflow.search_traces(
    experiment_ids=experiment_ids, order_by=["timestamp_ms DESC"]  # Most recent first
)
Pass multiple columns to the order_by parameter to sort by multiple fields:
mlflow.search_traces(
    experiment_ids=experiment_ids, order_by=["timestamp_ms DESC", "status ASC"]
)
Unpack Span Fields into DataFrame
When using the DataFrame return type, you can extract specific fields from spans into separate columns using the extract_fields parameter:
traces = mlflow.search_traces(
    extract_fields=[
        # Extract the "name" field in the "morning_greeting" span inputs
        "morning_greeting.inputs.name",
        # Extract all output fields in the "morning_greeting" span
        "morning_greeting.outputs",
    ],
    experiment_ids=[morning_experiment.experiment_id],
)

print(traces)
The output Pandas DataFrame will contain additional columns for the extracted span fields:
    trace_id                              ...     morning_greeting.inputs.name   morning_greeting.outputs
0   053adf2f5f5e4ad68d432e06e254c8a4        ...     'Tom'                          'Good morning Tom.'
This feature is particularly useful for creating evaluation datasets:
eval_data = traces.rename(
    columns={
        "morning_greeting.inputs.name": "inputs",
        "morning_greeting.outputs": "ground_truth",
    }
)
results = mlflow.evaluate(
    model,
    eval_data,
    targets="ground_truth",
    model_type="question-answering",
)
The extract_fields parameter is only supported when using return_type="pandas".
Pagination
For large result sets, use the MlflowClient.search_traces() API for pagination:
from mlflow import MlflowClient

client = MlflowClient()
page_token = None

while True:
    results = client.search_traces(
        experiment_ids=experiment_ids,
        page_token=page_token,
        max_results=100,  # Number of results per page
    )

    # Process the current page of results
    for trace in results:
        # Do something with each trace
        print(trace.trace_id)

    # Check if there are more pages
    if not results.token:
        break

    page_token = results.token