MLflow Tracing Schema
This document provides a detailed view of the schema for traces and its ingredients. MLflow traces are compatible to OpenTelemetry specs, but we also define a few additional layers of structure upon the OpenTelemetry Spans to provide additional metadata about the trace.
Structure of Traces
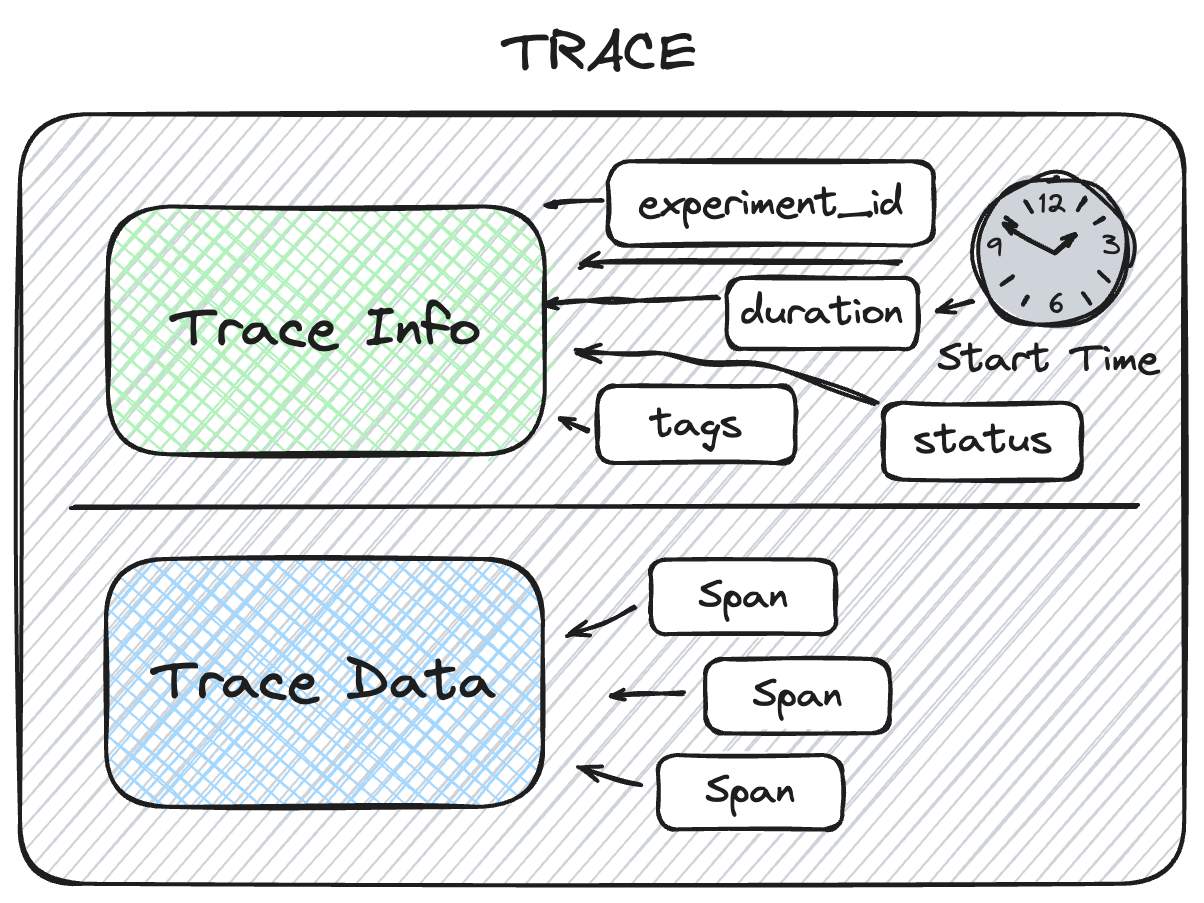
TL;DR: Trace = TraceInfo + TraceData where TraceData = List[Span]
Trace Structure
A Trace in MLflow consists of two components: Trace Info and Trace Data.
The metadata that aids in explaining the origination of the trace, the status of the trace, and the information about the total execution time is stored within the Trace Info. The Trace Data is comprised entirely of the instrumented Span objects that make up the core of the trace.
Trace Info Structure
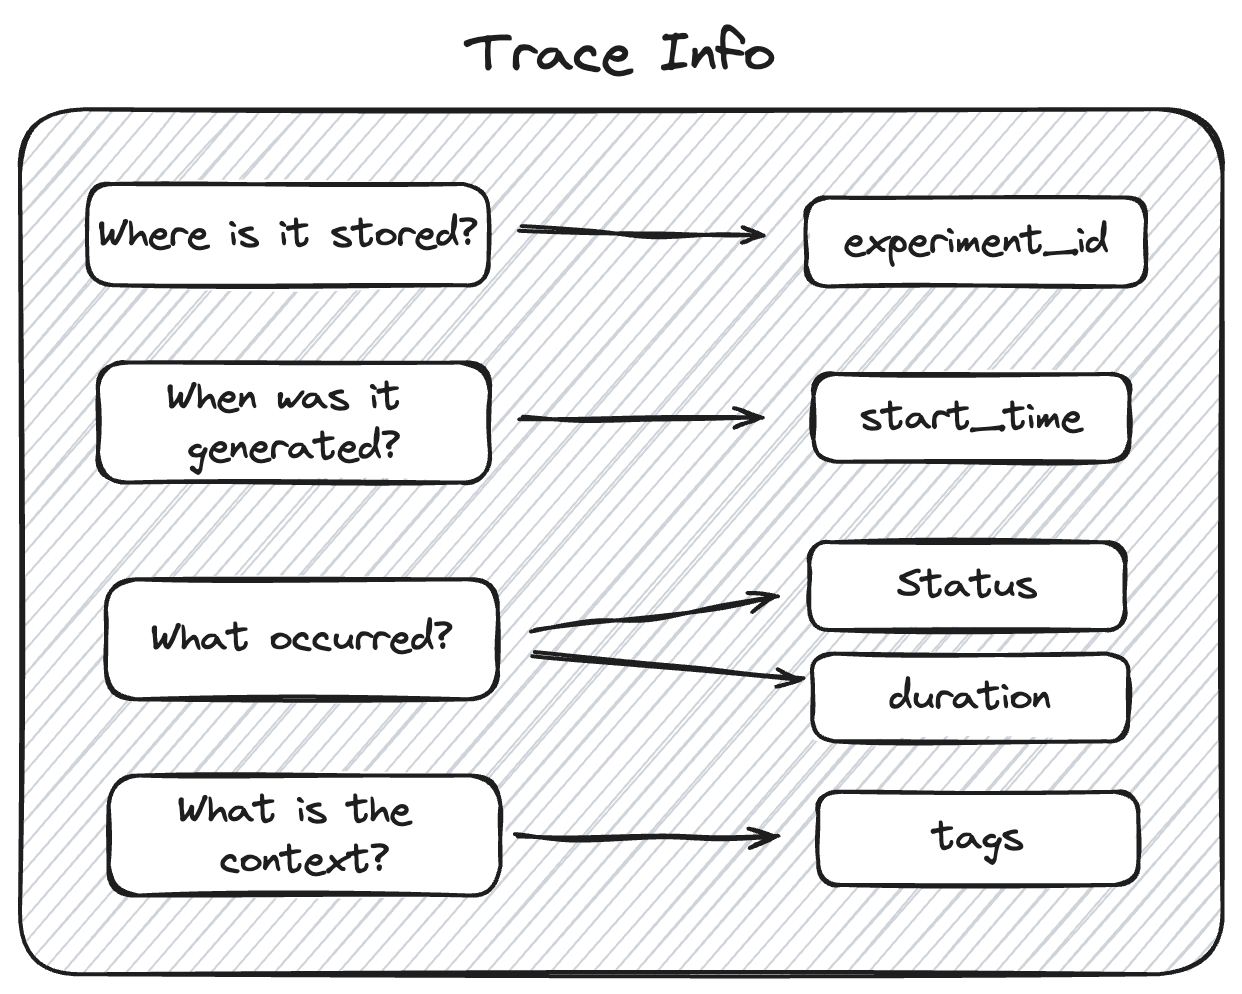
The Trace Info within MLflow's tracing feature aims to provide a lightweight snapshot of critical data about the overall trace. This includes the logistical information about the trace, such as the experiment_id, providing the storage location for the trace, as well as trace-level data such as start time and total execution time. The Trace Info also includes tags and status information for the trace as a whole.
Trace Data Structure
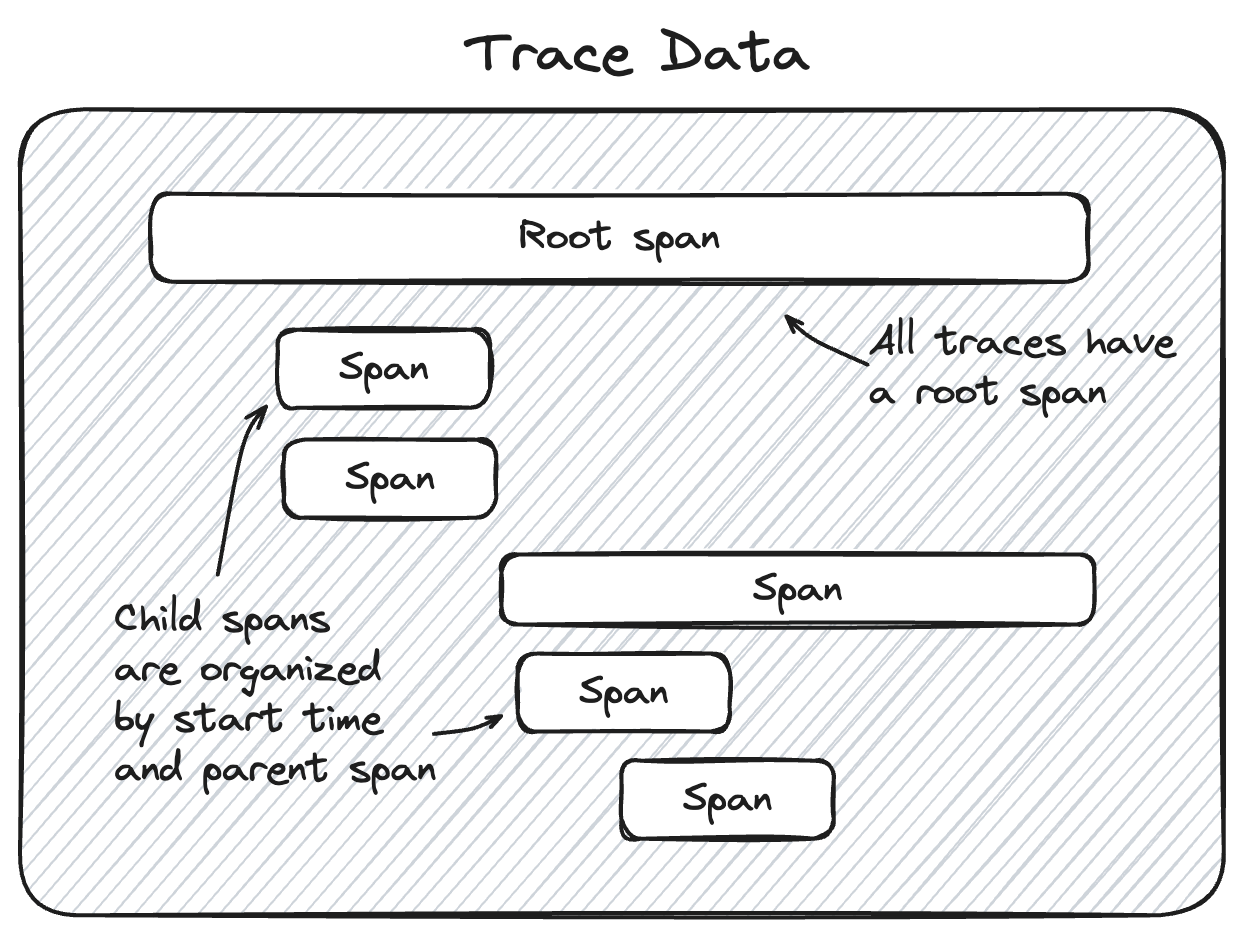
The Trace Data within MLflow's tracing feature provides the core of the trace information. Within this object is a list of Span objects that represent the individual steps of the trace. These spans are associated with one another in a hierarchical relationship, providing a clear order-of-operations linkage of what happened within your application during the trace.
Span Structure
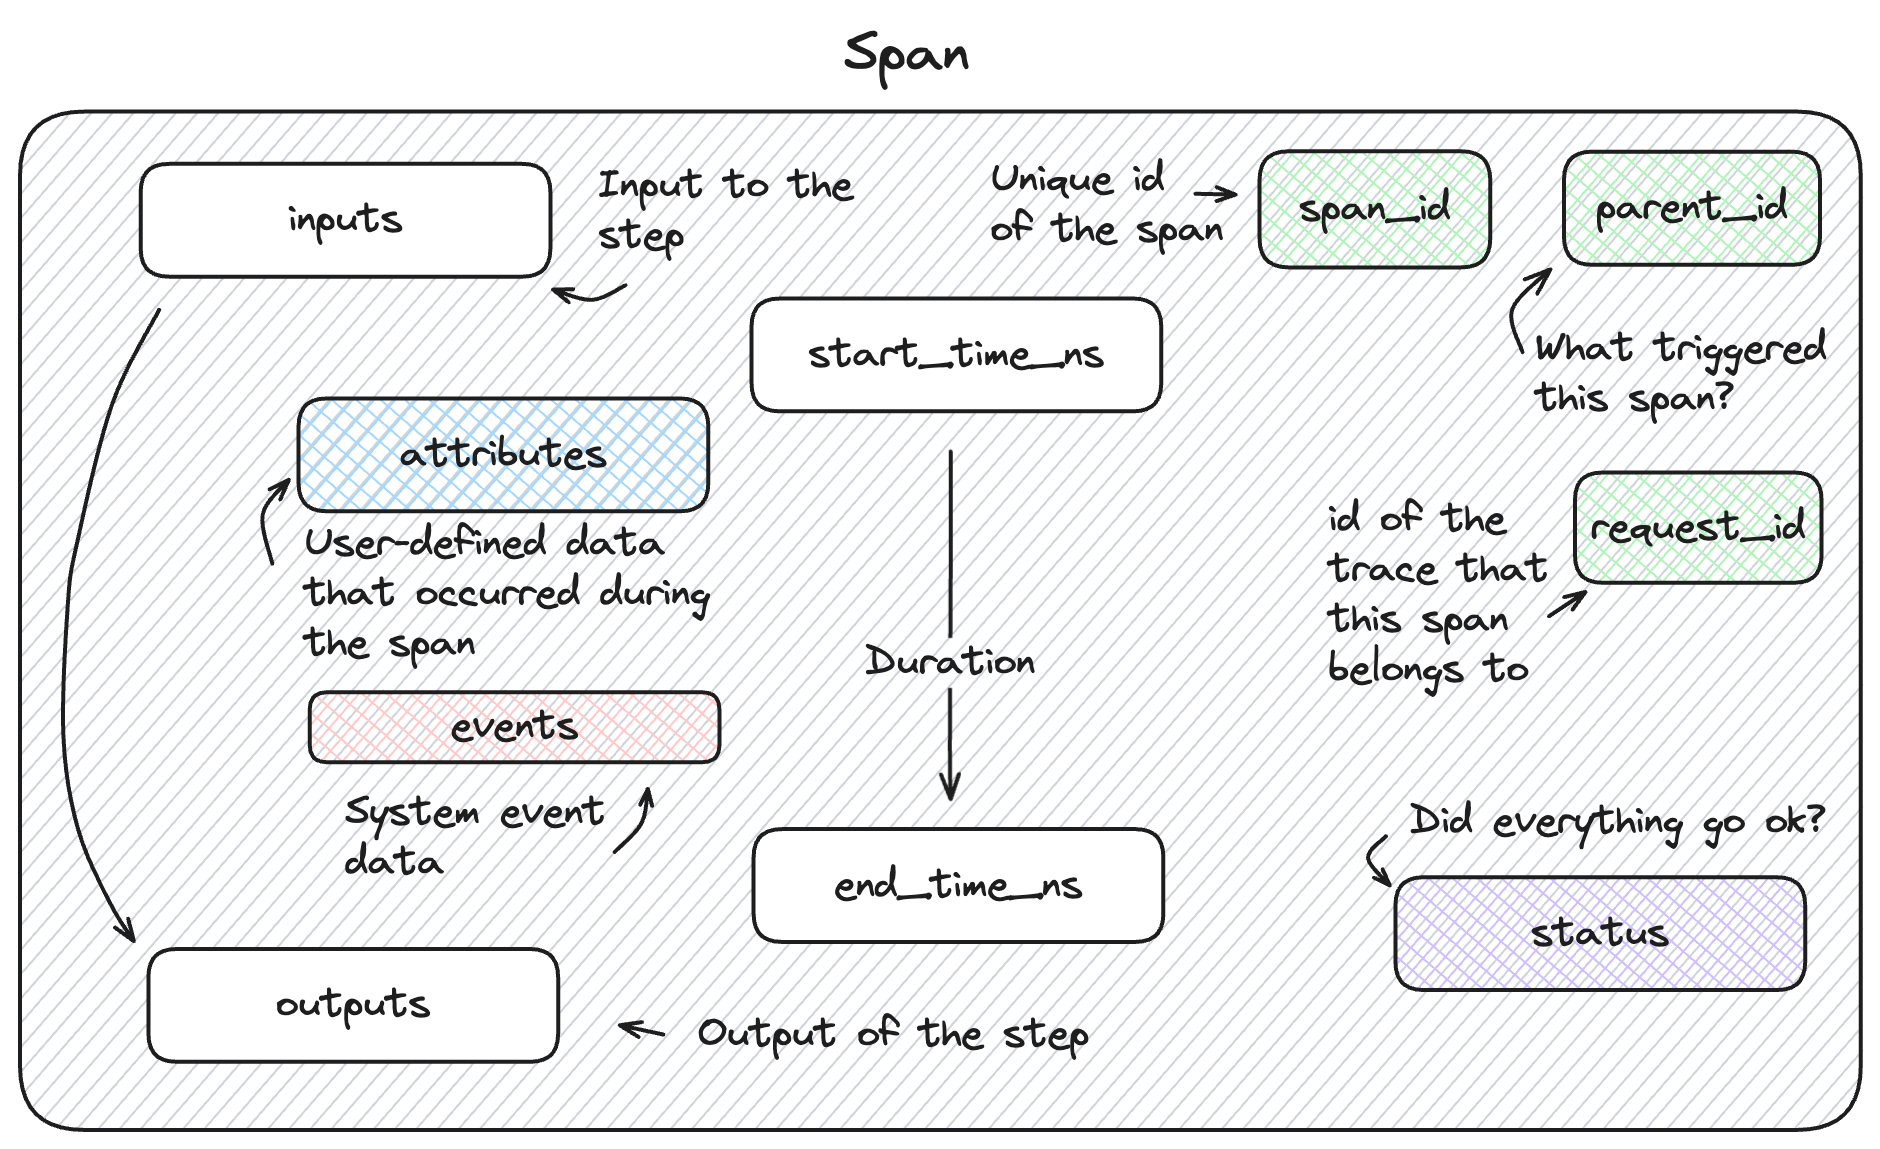
The Span object within MLflow's tracing feature provides detailed information about the individual steps of the trace. It complies to the OpenTelemetry Span spec. Each Span object contains information about the step being instrumented, including the span_id, name, start_time, parent_id, status, inputs, outputs, attributes, and events.
Trace
A trace is a root object composed of two components:
Tip
Check the API documentation for helper methods on these dataclass objects for more information on how to convert or extract data from them.
Trace Info
Trace Info is a dataclass object that contains metadata about the trace. This metadata includes information about the trace’s origin, status, and
various other data that aids in retrieving and filtering traces when used with mlflow.client.MlflowClient.search_traces() and for
navigation of traces within the MLflow UI.
To learn more about how TraceInfo metadata is used for searching, you can see examples here.
The data that is contained in the TraceInfo object is used to populate the trace view page within the MLflow tracking UI, as shown below.
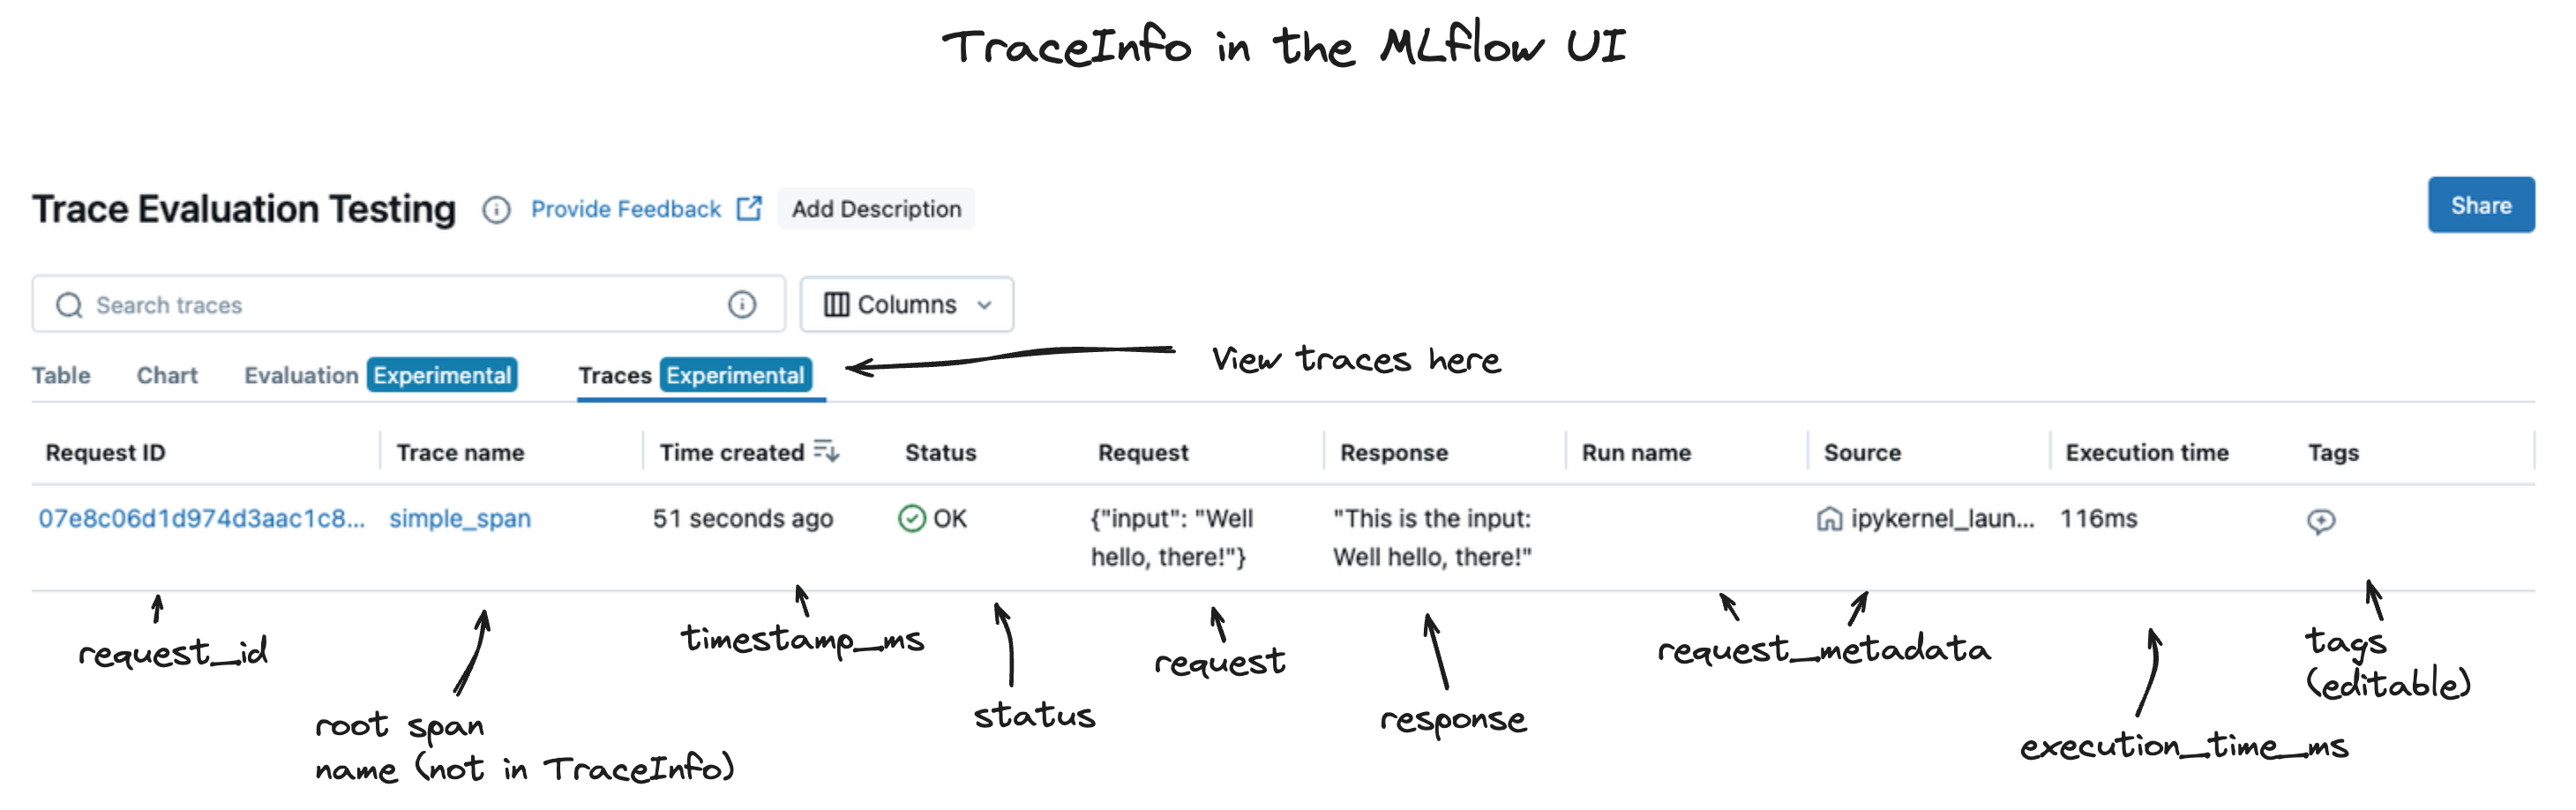
The primary components of MLflow TraceInfo objects are listed below.
Property |
Description |
Note |
|---|---|---|
request_id |
A unique identifier for the trace. The identifier is used within MLflow and integrated system to resolve the event being captured and to provide associations for external systems to map the logged trace to the originating caller. |
This value is generated by the tracing backend and is immutable. Within the tracing client APIs, you will need to deliberately pass this value to the |
experiment_id |
The ID of the experiment in which the trace was logged. All logged traces are associated with the current active experiment when the trace is generated (during invocation of an instrumented object). |
This value is immutable and is set by the tracing backend. It is a system-controlled value that is very useful when using the |
timestamp_ms |
The time that marks the moment when the root span of the trace was created. This is a Unix timestamp in milliseconds. |
The time reflected in this property is the time at with the trace was created, not the time at which a request to your application was made. As such, it does not factor into account the time it took to process the request to the environment in which your application is being served, which may introduce additional latency to the total round trip time, depending on network configurations. |
execution_time_ms |
The time that marks the moment when the call to end the trace is made. This is a Unix timestamp in milliseconds. |
This time does not include the networking time associated with sending the response from the environment that generates the trace to the environment that is consuming the application’s invocation result. |
status |
An enumerated value that denotes the status of the trace. |
|
request_metadata |
The request metadata are additional key-value pairs of information that are associated with the Trace, set and modified by the tracing backend. |
These are not open for addition or modification by the user, but can provide additional context about the trace, such as an MLflow |
tags |
User-defined key-value pairs that can be applied to a trace for applying additional context, aid in search functionality, or to provide additional information during the creation or after the successful logging of a trace. |
These tags are fully mutable and can be changed at any time, even long after a trace has been logged to an experiment. |
Trace Data
The MLflow TraceData object is a dataclass object that holds the core of the trace data. This object contains
the following elements:
Property |
Description |
Note |
|---|---|---|
request |
The |
Due to the varied structures of inputs that could go to a given application that is being instrumented by MLflow Tracing, all inputs are JSON serialized for compatibility’s sake. This allows for the input data to be stored in a consistent format, regardless of the input data’s structure. |
spans |
This property is a list of |
For further information on the structure of Span objects, see the section below. |
response |
The |
Similar to the request property, this value is a JSON-serialized string to maximize compatibility of disparate formats. |
Span Schema
Spans are the core of the trace data. They record key, critical data about each of the steps within your genai application.
When you view your traces within the MLflow UI, you’re looking at a collection of spans, as shown below.
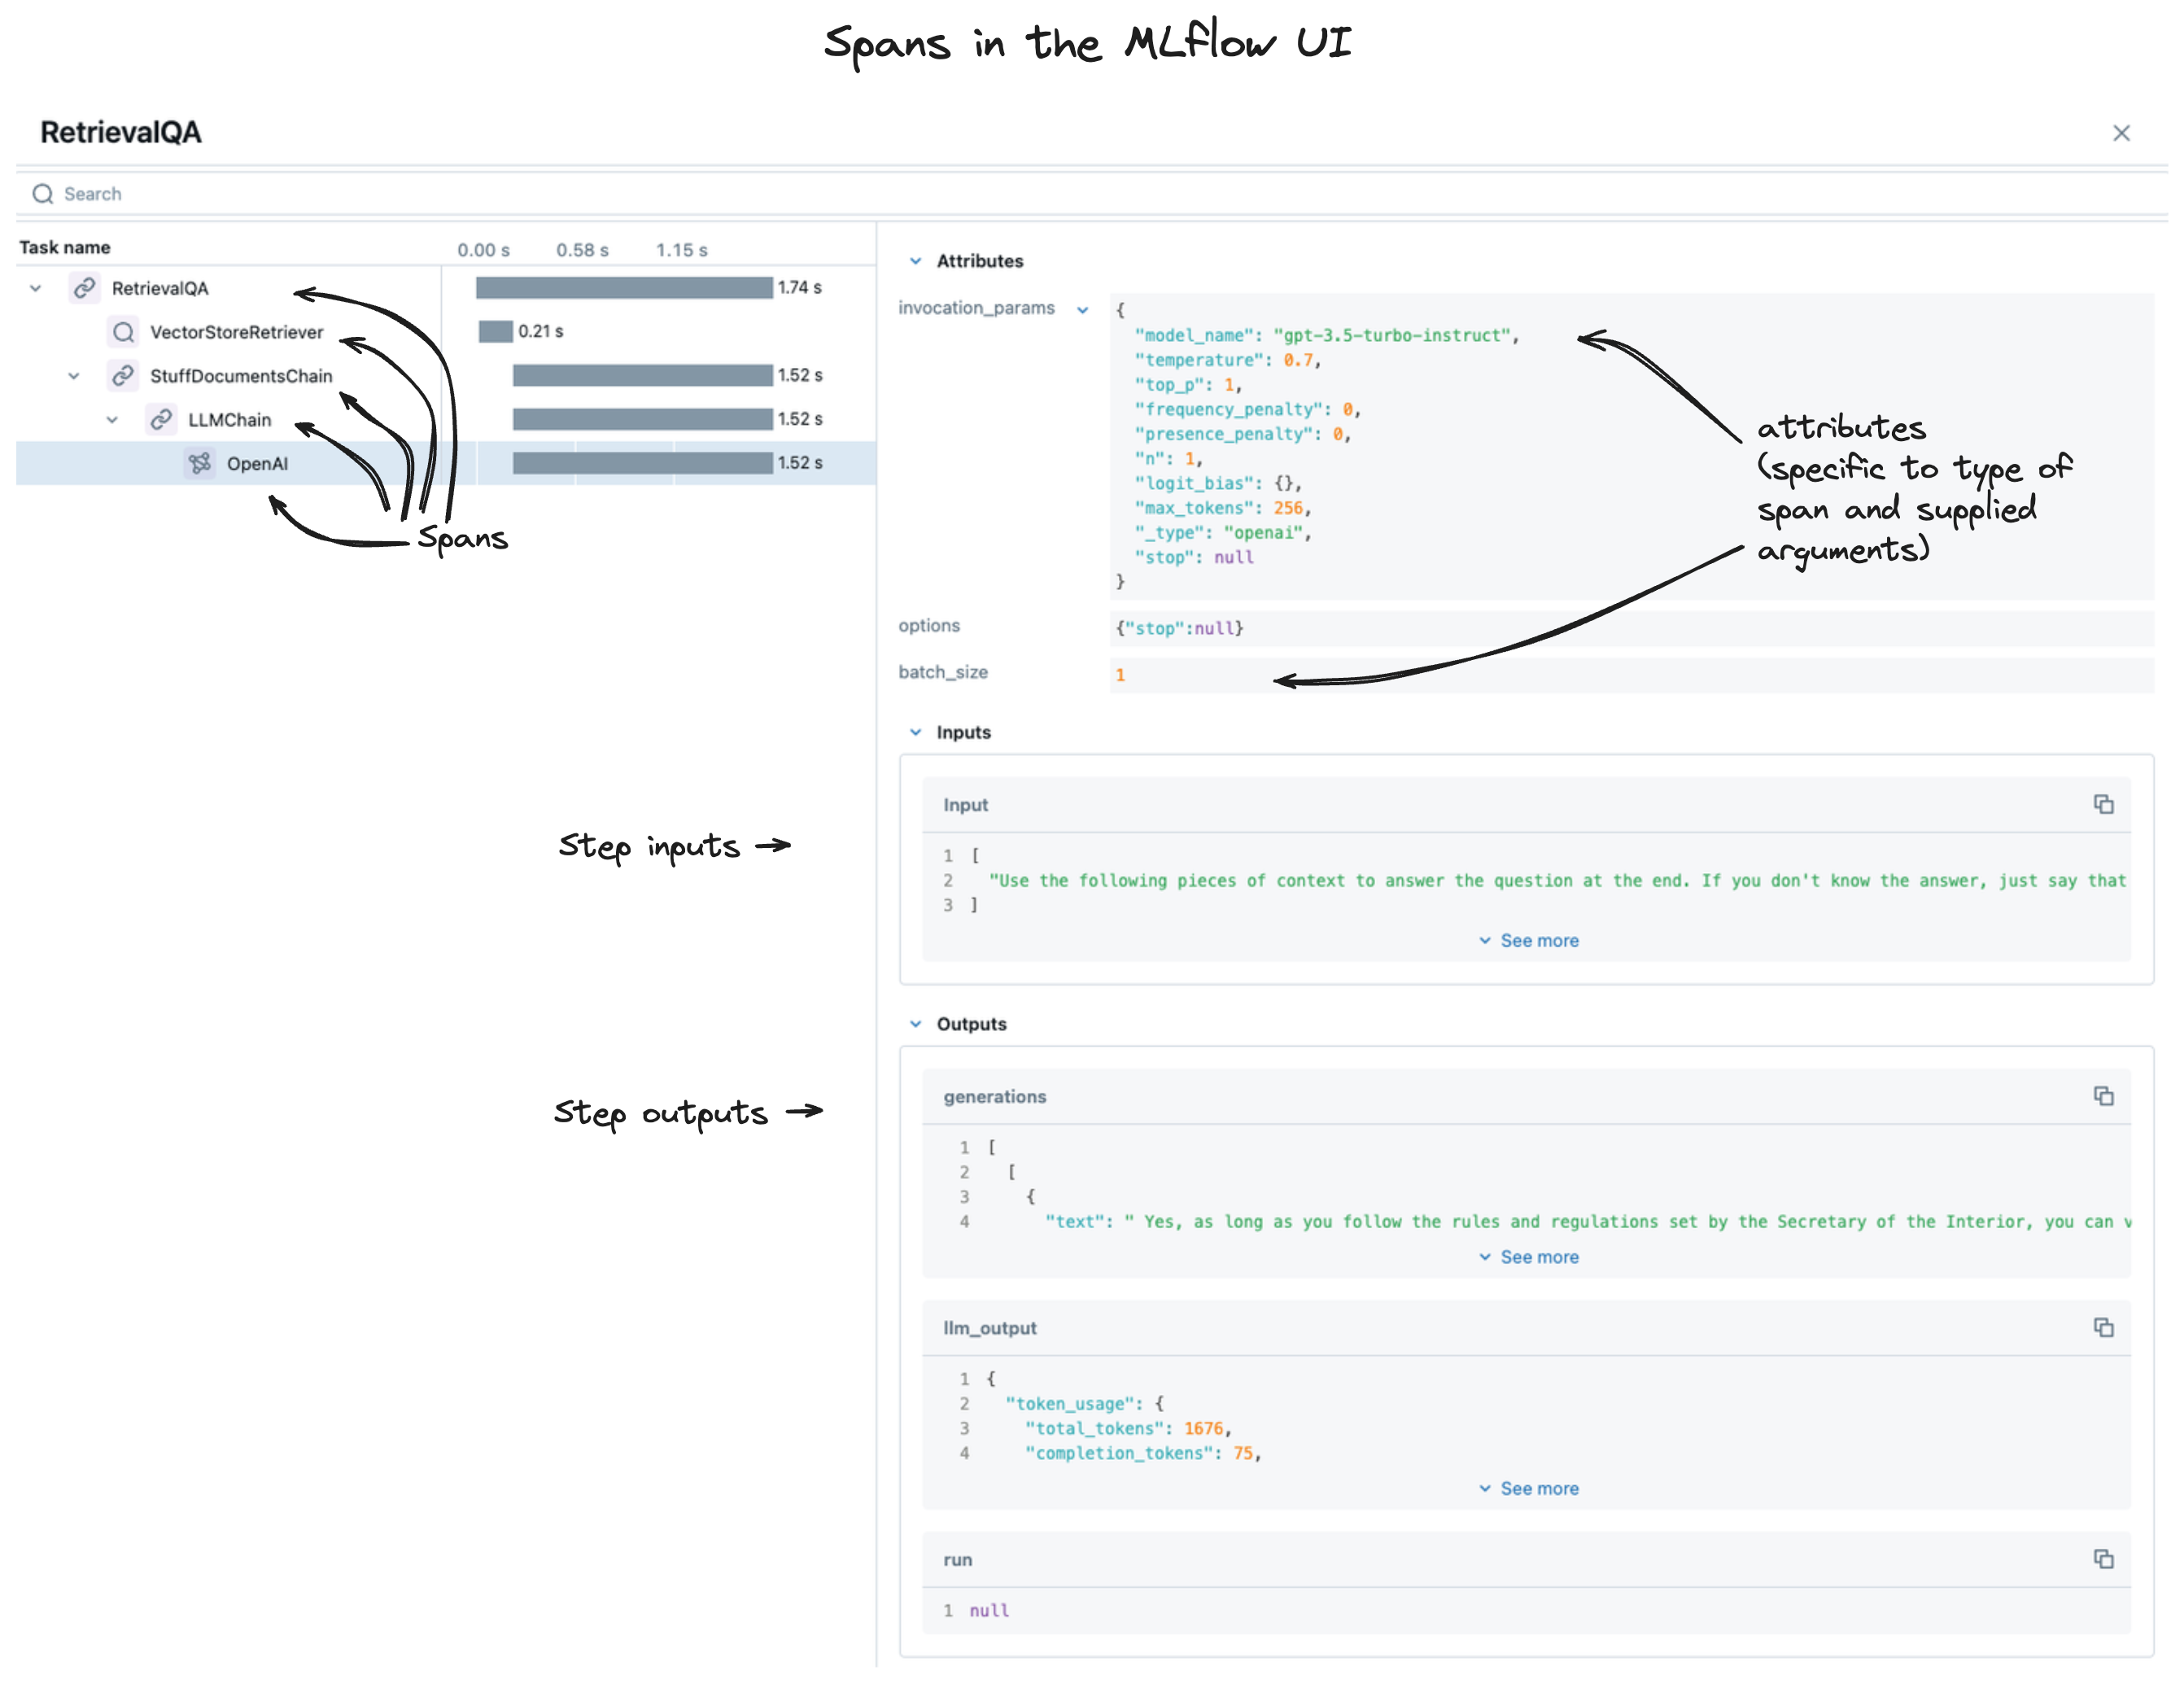
The sections below provide a detailed view of the structure of a span.
Property |
Description |
Note |
|---|---|---|
inputs |
The inputs are stored as JSON-serialized strings, representing the input data that is passed into the particular stage (step) of your application. Due to the wide variety of input data that can be passed between specific stages of a GenAI application, this data may be extremely large (such as when using the output of a vector store retrieval step). |
Reviewing the Inputs, along with the Outputs, of individual stages can dramatically increase the ability to diagnose and debug issues that exist with responses coming from your application. |
outputs |
The outputs are stored as JSON-serialized strings, representing the output data that is passed out of the particular stage (step) of your application. |
Just as with the Inputs, the Outputs can be quite large, depending on the complexity of the data that is being passed between stages. |
attributes |
Attributes are metadata that are associated with a given step within your application. These attributes are key-value pairs that can be used to provide insight into behavioral modifications for function and method calls, giving insight into how modification of them can affect the performance of your application. |
Common examples of attributes that could be associated with a given span include:
These attributes provide additional context and insight into the results that are present in the |
events |
Events are a system-level property that is optionally applied to a span only if there was an issue during the execution of the span. These events contain information about exceptions that were thrown in the instrumented call, as well as the stack trace. |
This data is structured within a
The attributes property contains the stack trace of the exception that was thrown during the execution of the span if such an error occurred during execution. |
parent_id |
The |
A span must have a |
span_id |
The |
A |
request_id |
The |
The |
name |
The |
It is recommended to provide a name for your span that is unique and relevant to the functionality that is being executed when using manual instumentation via the client or fluent APIs. Generic names for spans or confusing names can make it difficult to diagnose issues when reviewing traces. |
status |
The status of a span is reflected in a value from the enumeration object
|
Evaluating the status of spans can greatly reduce the amount of time and effort required to diagnose issues with your applications. |
start_time_ns |
The unix timestamp (in nanoseconds) when the span was started. |
The precision of this property is higher than that of the trace start time, allowing for more granular analysis of the execution time of very short-lived spans. |
end_time_ns |
The unix timestamp (in nanoseconds) when the span was ended. |
This precision is higher than the trace timestamps, similar to the |
Schema for specific span types
MLflow has a set of 10 predefined types of spans (see mlflow.entities.SpanType), and
certain span types have properties that are required in order to enable additional functionality
within the UI and downstream tasks such as evaluation.
Retriever Spans
The RETRIEVER span type is used for operations involving retrieving data from a data store (for example, querying
documents from a vector store). The RETRIEVER span type has the following schema:
Property |
Description |
Note |
|---|---|---|
Input |
There are no restrictions on the span inputs |
|
Output |
The output must be of type
|
This output structure is guaranteed to be provided if the traces are generated via MLflow autologging for the LangChain and LlamaIndex flavors.
By conforming to this specification, |
Attributes |
There are no restrictions on the span attributes |
* For example, both [Document(page_content="Hello world", metadata={"doc_uri": "https://example.com"})] and
[{"page_content": "Hello world", "metadata": {"doc_uri": "https://example.com"}}] are valid outputs for a RETRIEVER span.
Chat Completion Spans
Spans of type CHAT_MODEL or LLM are used to represent interactions with a chat completions API
(for example, OpenAI’s chat completions,
or Anthropic’s messages API). As providers can have
different schemas for their API, there are no restrictions on the format of the span’s inputs and
outputs.
However, it is still important to have a common schema in order to enable certain UI features (e.g. rich conversation display), and to make authoring evaluation functions easier. To support this, we specify some custom attributes for standardized chat messages and tool defintions:
Attribute Name |
Description |
Note |
|---|---|---|
mlflow.chat.messages |
This attribute represents the system/user/assistant messages involved in the conversation with the chat model. It enables rich conversation rendering in the UI, and will also be used in MLflow evaluation in the future. The type must be |
This attribute can be conveniently set using the |
mlflow.chat.tools |
This attribute represents the tools that were available for the chat model to call. In the OpenAI context, this would be equivalent to the tools param in the Chat Completions API. The type must be |
This attribute can be conveniently set using the |
Please refer to the example below for a quick demonstration of how to use the utility functions described above, as well as
how to retrieve them using the span.get_attribute() function:
import mlflow
from mlflow.entities.span import SpanType
from mlflow.tracing.constant import SpanAttributeKey
from mlflow.tracing import set_span_chat_messages, set_span_chat_tools

# example messages and tools
messages = [
    {
        "role": "system",
        "content": "please use the provided tool to answer the user's questions",
    },
    {"role": "user", "content": "what is 1 + 1?"},
]

tools = [
    {
        "type": "function",
        "function": {
            "name": "add",
            "description": "Add two numbers",
            "parameters": {
                "type": "object",
                "properties": {
                    "a": {"type": "number"},
                    "b": {"type": "number"},
                },
                "required": ["a", "b"],
            },
        },
    }
]


@mlflow.trace(span_type=SpanType.CHAT_MODEL)
def call_chat_model(messages, tools):
    # mocking a response
    response = {
        "role": "assistant",
        "tool_calls": [
            {
                "id": "123",
                "function": {"arguments": '{"a": 1,"b": 2}', "name": "add"},
                "type": "function",
            }
        ],
    }

    combined_messages = messages + [response]

    span = mlflow.get_current_active_span()
    set_span_chat_messages(span, combined_messages)
    set_span_chat_tools(span, tools)

    return response


call_chat_model(messages, tools)

trace = mlflow.get_last_active_trace()
span = trace.data.spans[0]

print("Messages: ", span.get_attribute(SpanAttributeKey.CHAT_MESSAGES))
print("Tools: ", span.get_attribute(SpanAttributeKey.CHAT_TOOLS))