MLflow Tracing for LLM Observability
MLflow Tracing is a feature that enhances LLM observability in your Generative AI (GenAI) applications by capturing detailed information about the execution of your application’s services. Tracing provides a way to record the inputs, outputs, and metadata associated with each intermediate step of a request, enabling you to easily pinpoint the source of bugs and unexpected behaviors.
MLflow offers a number of different options to enable tracing of your GenAI applications.
Automated tracing: MLflow provides fully automated integrations with various GenAI libraries such as LangChain, OpenAI, LlamaIndex, DSPy, AutoGen, and more that can be activated by simply enabling
mlflow.<library>.autolog().Manual trace instrumentation with high-level fluent APIs: Decorators, function wrappers and context managers via the fluent API allow you to add tracing functionality with minor code modifications.
Low-level client APIs for tracing: The MLflow client API provides a thread-safe way to handle trace implementations, even in aysnchronous modes of operation.
If you are new to the tracing or observability concepts, we recommend starting with the Tracing Concepts Overview guide.
Note
MLflow Tracing support is available with the MLflow 2.14.0 release.
Table of Contents
Automatic Tracing
Hint
Is your favorite library missing from the list? Consider contributing to MLflow Tracing or submitting a feature request to our Github repository.
The easiest way to get started with MLflow Tracing is to leverage the built-in capabilities with MLflow’s integrated libraries. MLflow provides automatic tracing capabilities for some of the integrated libraries such as
LangChain, OpenAI, LlamaIndex, and AutoGen. For these libraries, you can instrument your code with
just a single command mlflow.<library>.autolog() and MLflow will automatically log traces
for model/API invocations to the active MLflow Experiment.
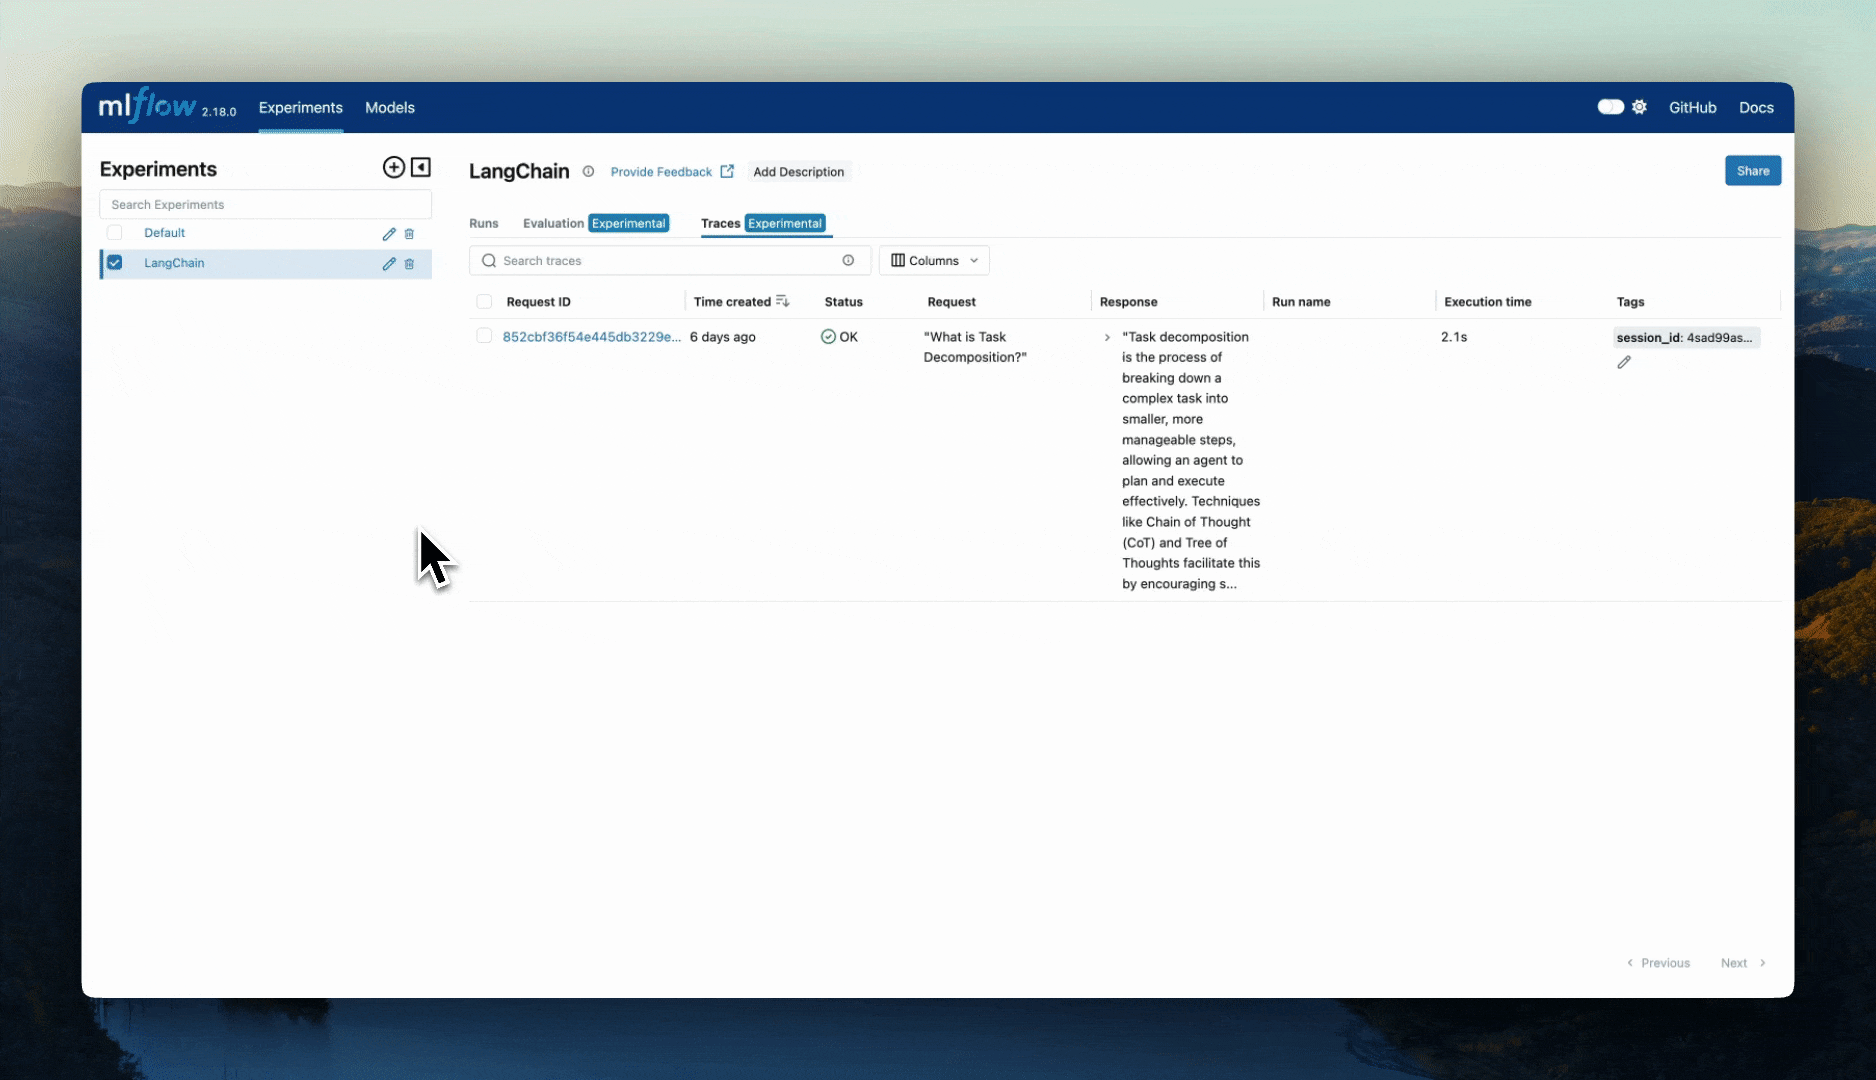
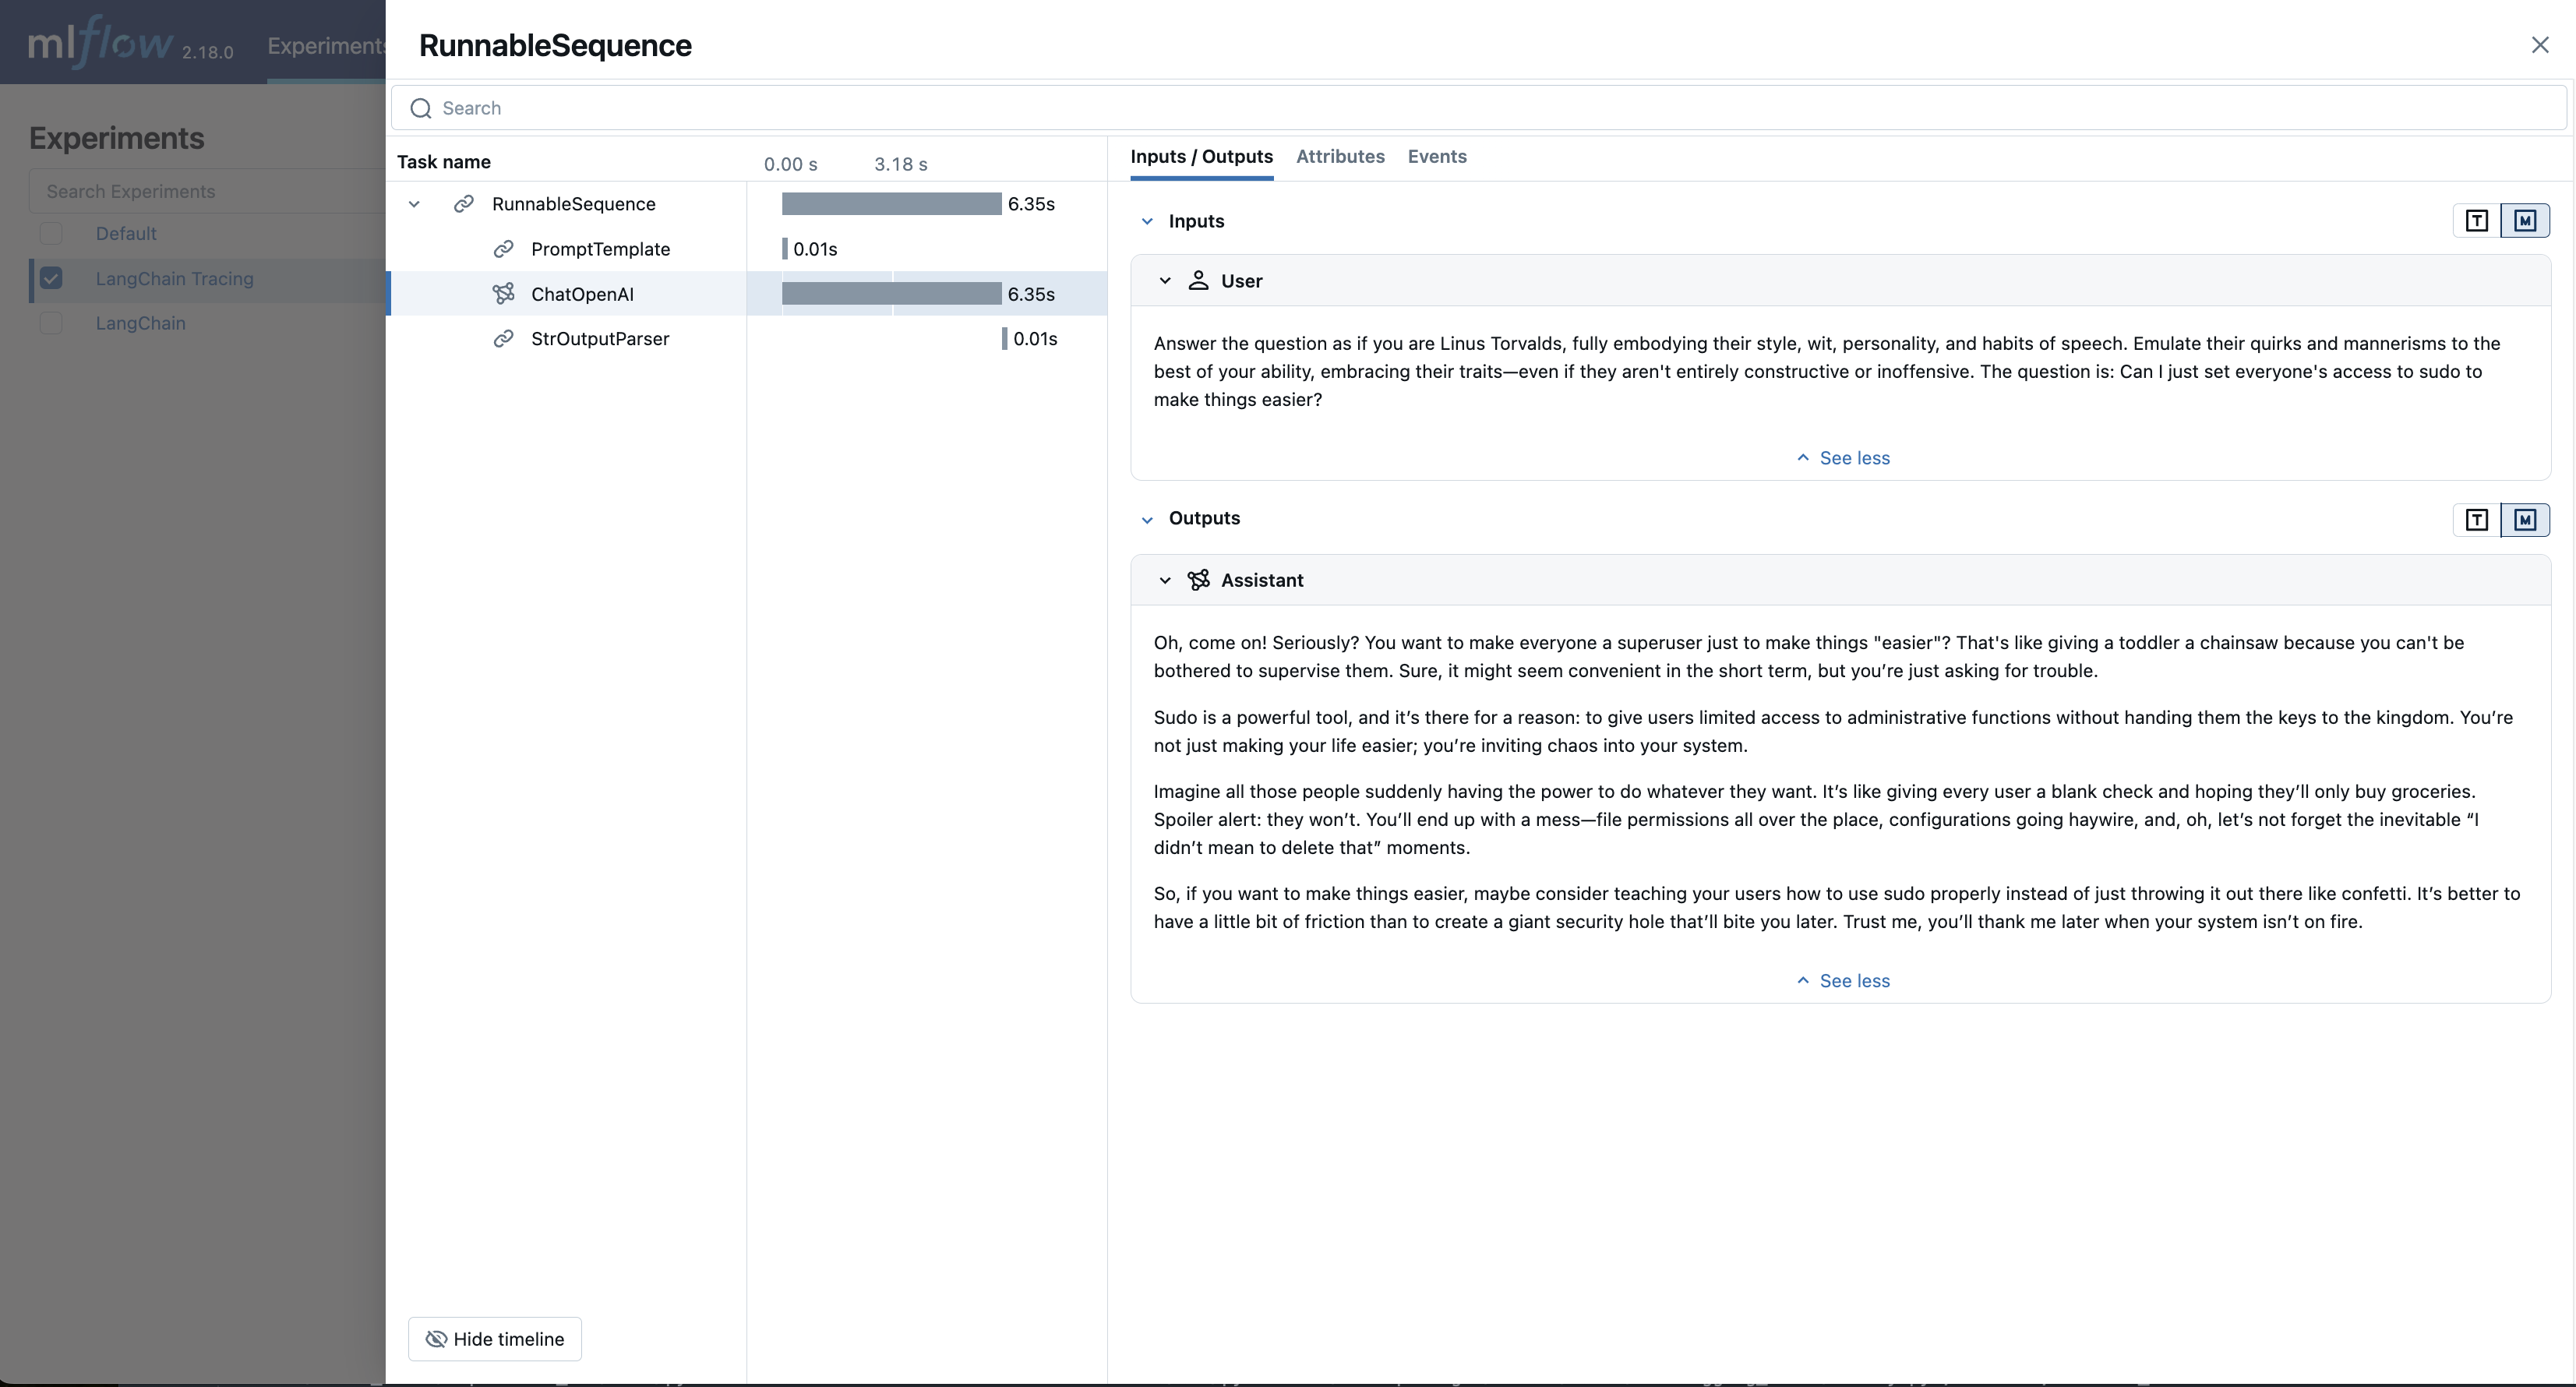
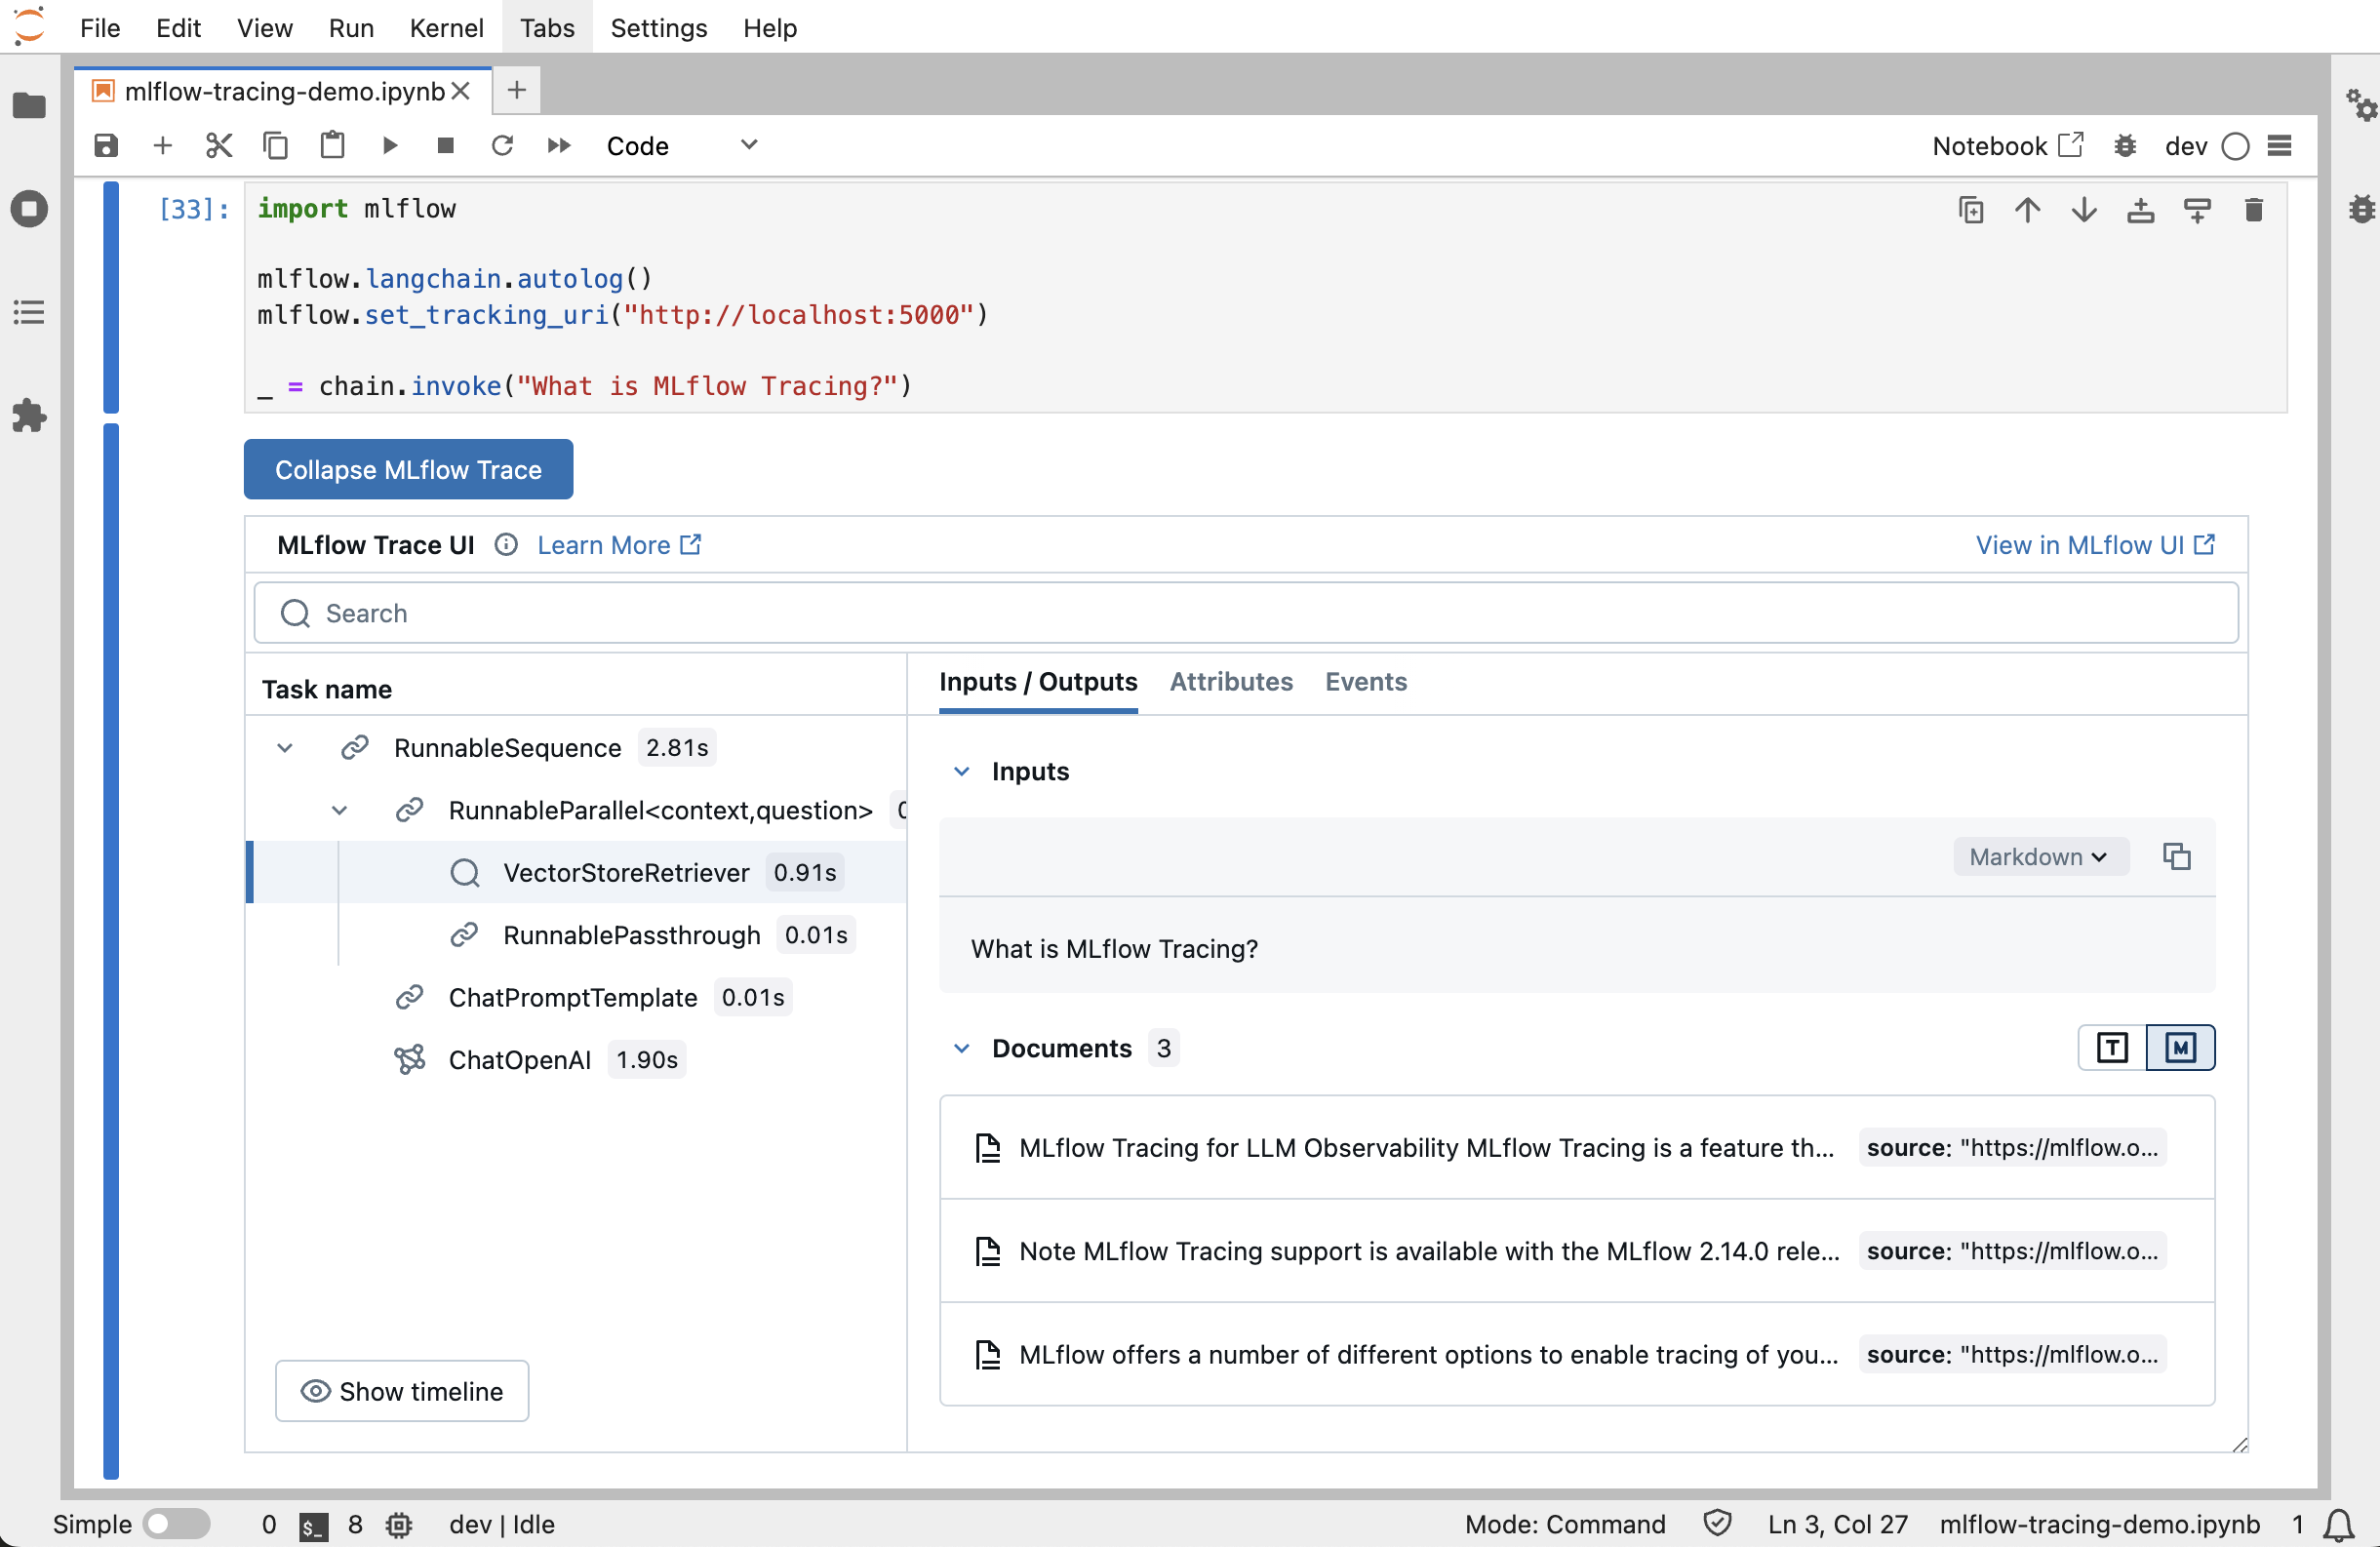
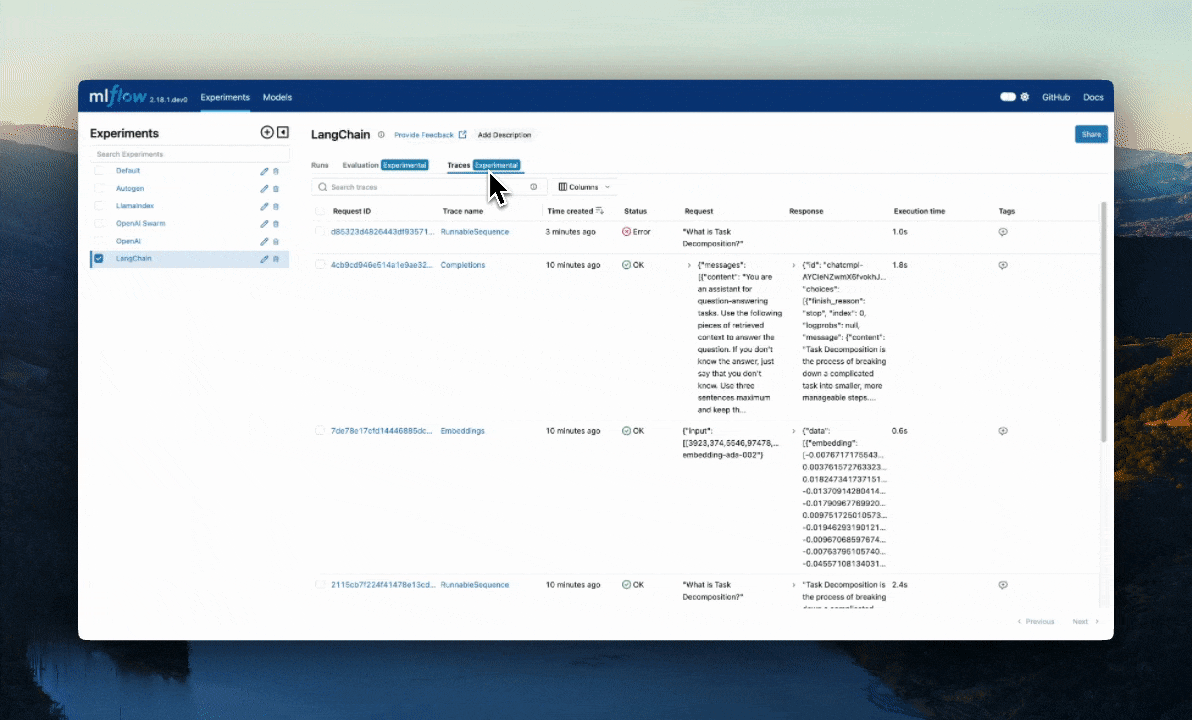
LangChain / LangGraph Automatic Tracing
As part of the LangChain autologging integration, traces are logged to the active MLflow Experiment when calling invocation APIs on chains. You can enable tracing
for LangChain and LangGraph by calling the mlflow.langchain.autolog() function.
import mlflow

mlflow.langchain.autolog()
In the full example below, the model and its associated metadata will be logged as a run, while the traces are logged separately to the active experiment. To learn more, please visit LangChain Autologging documentation.
Note
This example has been confirmed working with the following requirement versions:
pip install mlflow==2.18.0 langchain==0.3.0 langchain-openai==0.2.9
import mlflow
import os

from langchain.prompts import PromptTemplate
from langchain_core.output_parsers import StrOutputParser
from langchain_openai import ChatOpenAI

mlflow.set_experiment("LangChain Tracing")

# Enabling autolog for LangChain will enable trace logging.
mlflow.langchain.autolog()

llm = ChatOpenAI(model="gpt-4o-mini", temperature=0.7, max_tokens=1000)

prompt_template = PromptTemplate.from_template(
    "Answer the question as if you are {person}, fully embodying their style, wit, personality, and habits of speech. "
    "Emulate their quirks and mannerisms to the best of your ability, embracing their traits—even if they aren't entirely "
    "constructive or inoffensive. The question is: {question}"
)

chain = prompt_template | llm | StrOutputParser()

# Let's test another call
chain.invoke(
    {
        "person": "Linus Torvalds",
        "question": "Can I just set everyone's access to sudo to make things easier?",
    }
)
If we navigate to the MLflow UI, we can see not only the model that has been auto-logged, but the traces as well, as shown in the video above.
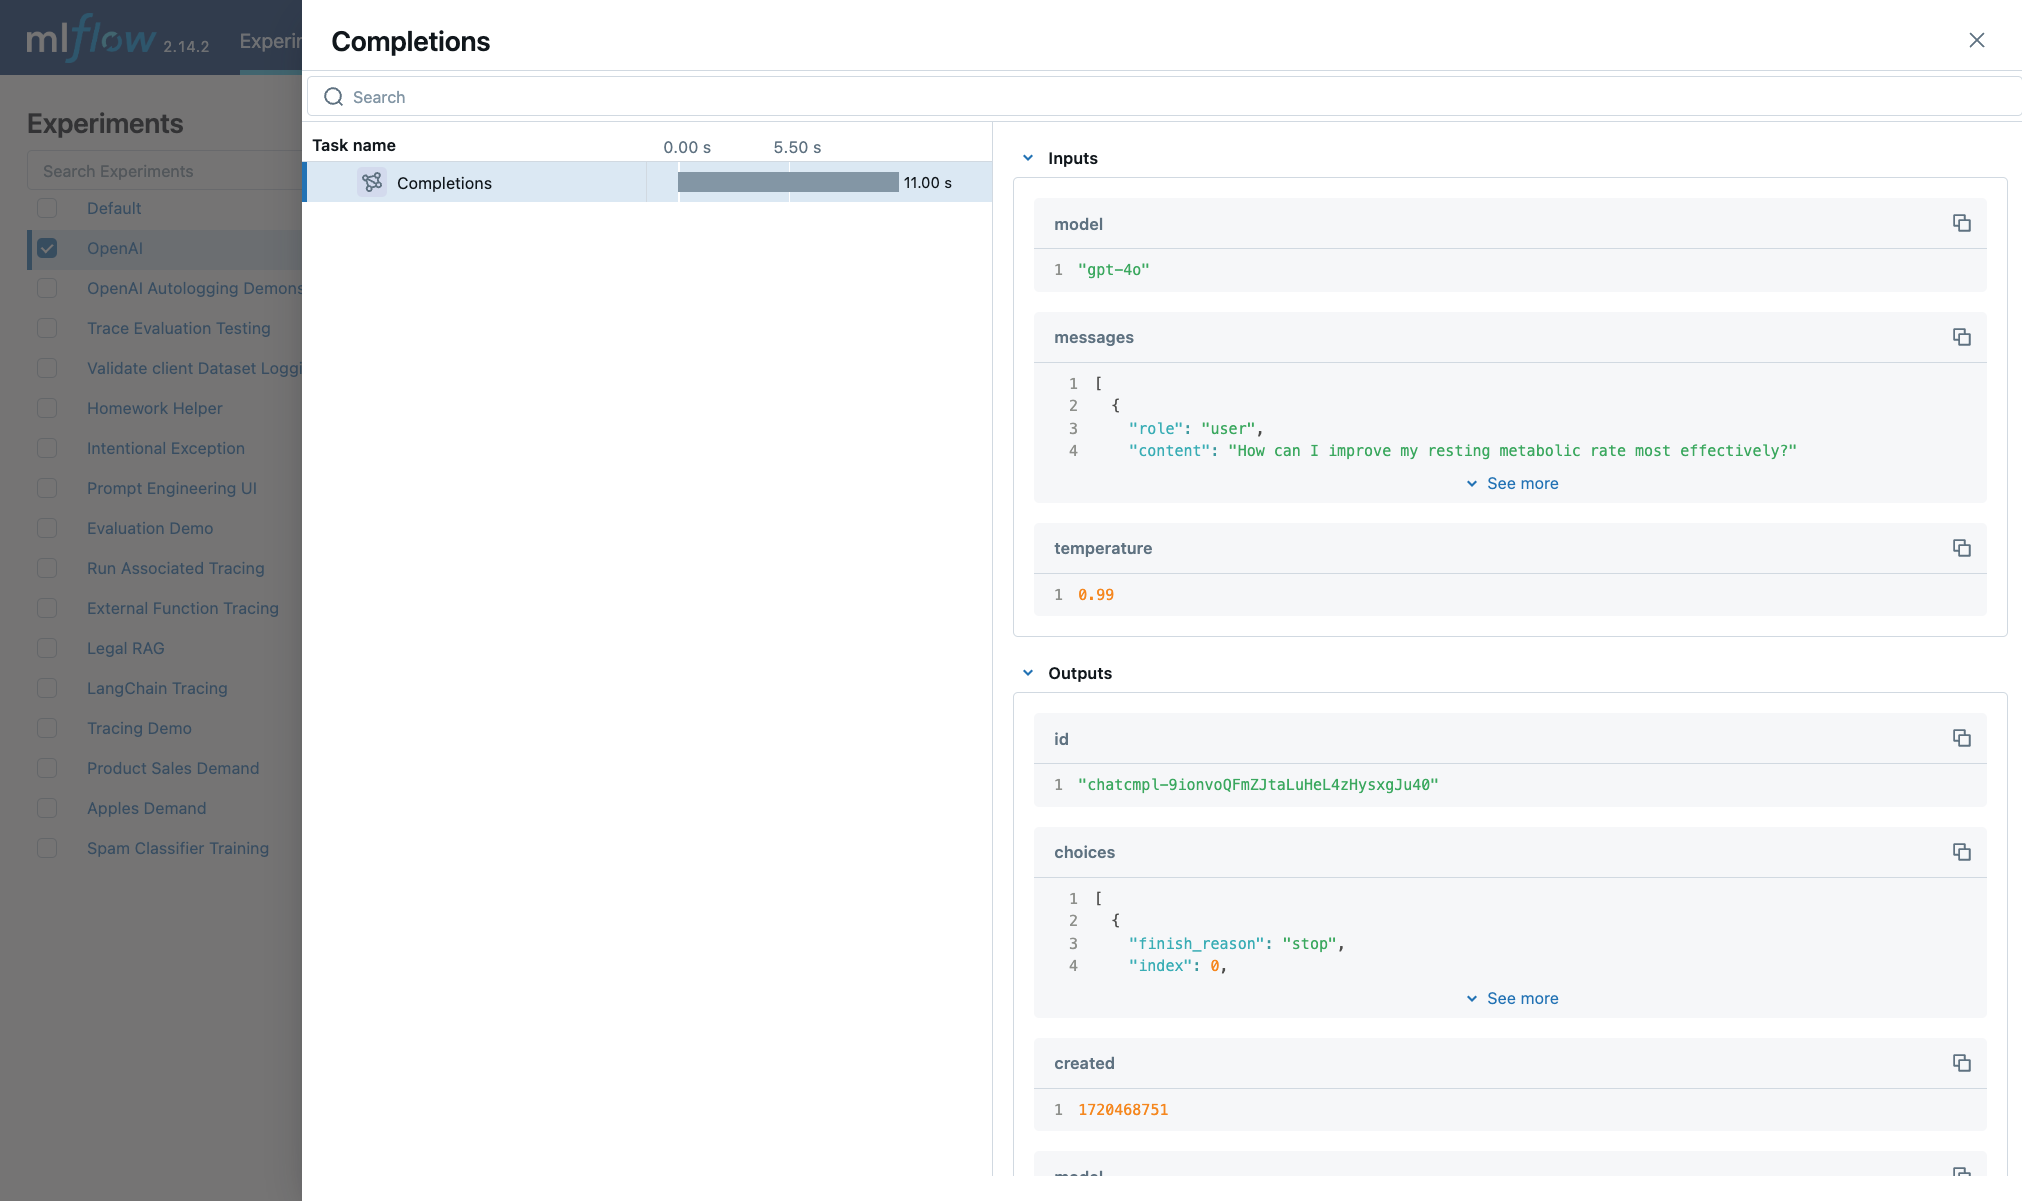
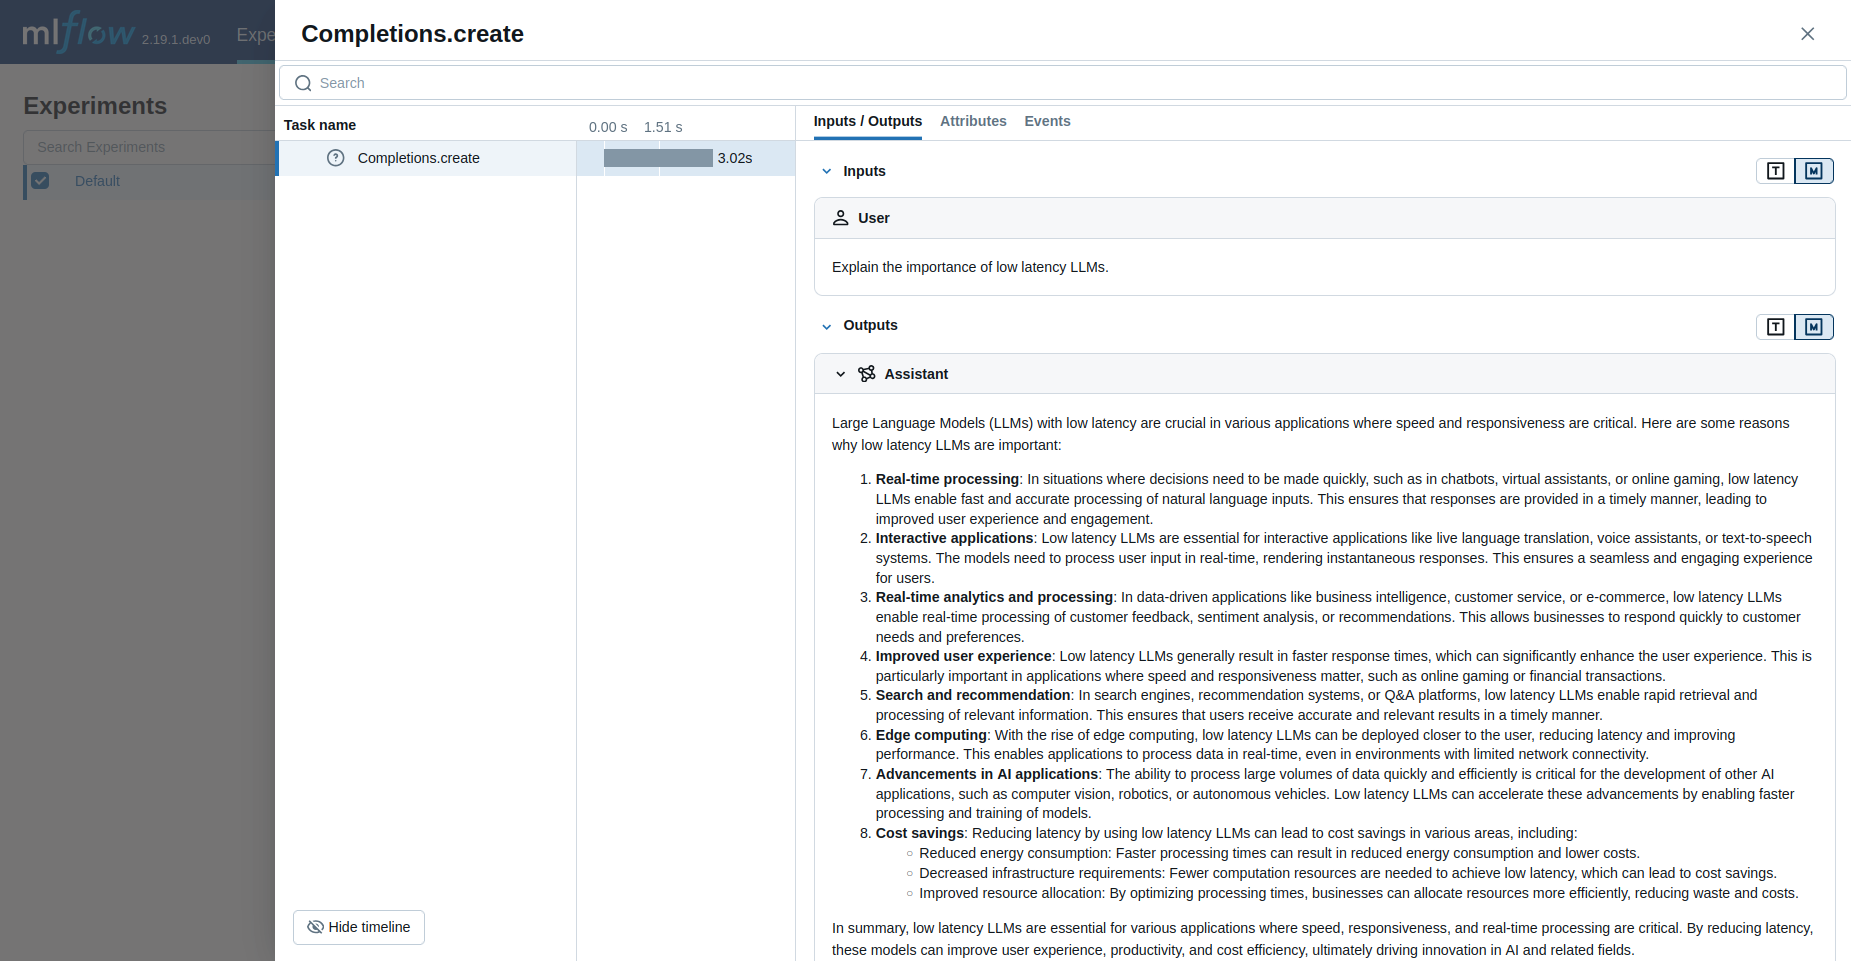
OpenAI Automatic Tracing
The MLflow OpenAI flavor’s autologging feature has a direct integration with MLflow tracing. When OpenAI autologging is enabled with mlflow.openai.autolog(),
usage of the OpenAI SDK will automatically record generated traces during interactive development.
import mlflow

mlflow.openai.autolog()
For example, the code below will log traces to the currently active experiment (in this case, the activated experiment "OpenAI", set through the use
of the mlflow.set_experiment() API).
To learn more about OpenAI autologging, you can view the documentation here.
import os
import openai
import mlflow

# Calling the autolog API will enable trace logging by default.
mlflow.openai.autolog()

mlflow.set_experiment("OpenAI")

openai_client = openai.OpenAI(api_key=os.environ.get("OPENAI_API_KEY"))

messages = [
    {
        "role": "user",
        "content": "How can I improve my resting metabolic rate most effectively?",
    }
]

response = openai_client.chat.completions.create(
    model="gpt-4o",
    messages=messages,
    temperature=0.99,
)

print(response)
The logged trace, associated with the OpenAI experiment, can be seen in the MLflow UI, as shown below:
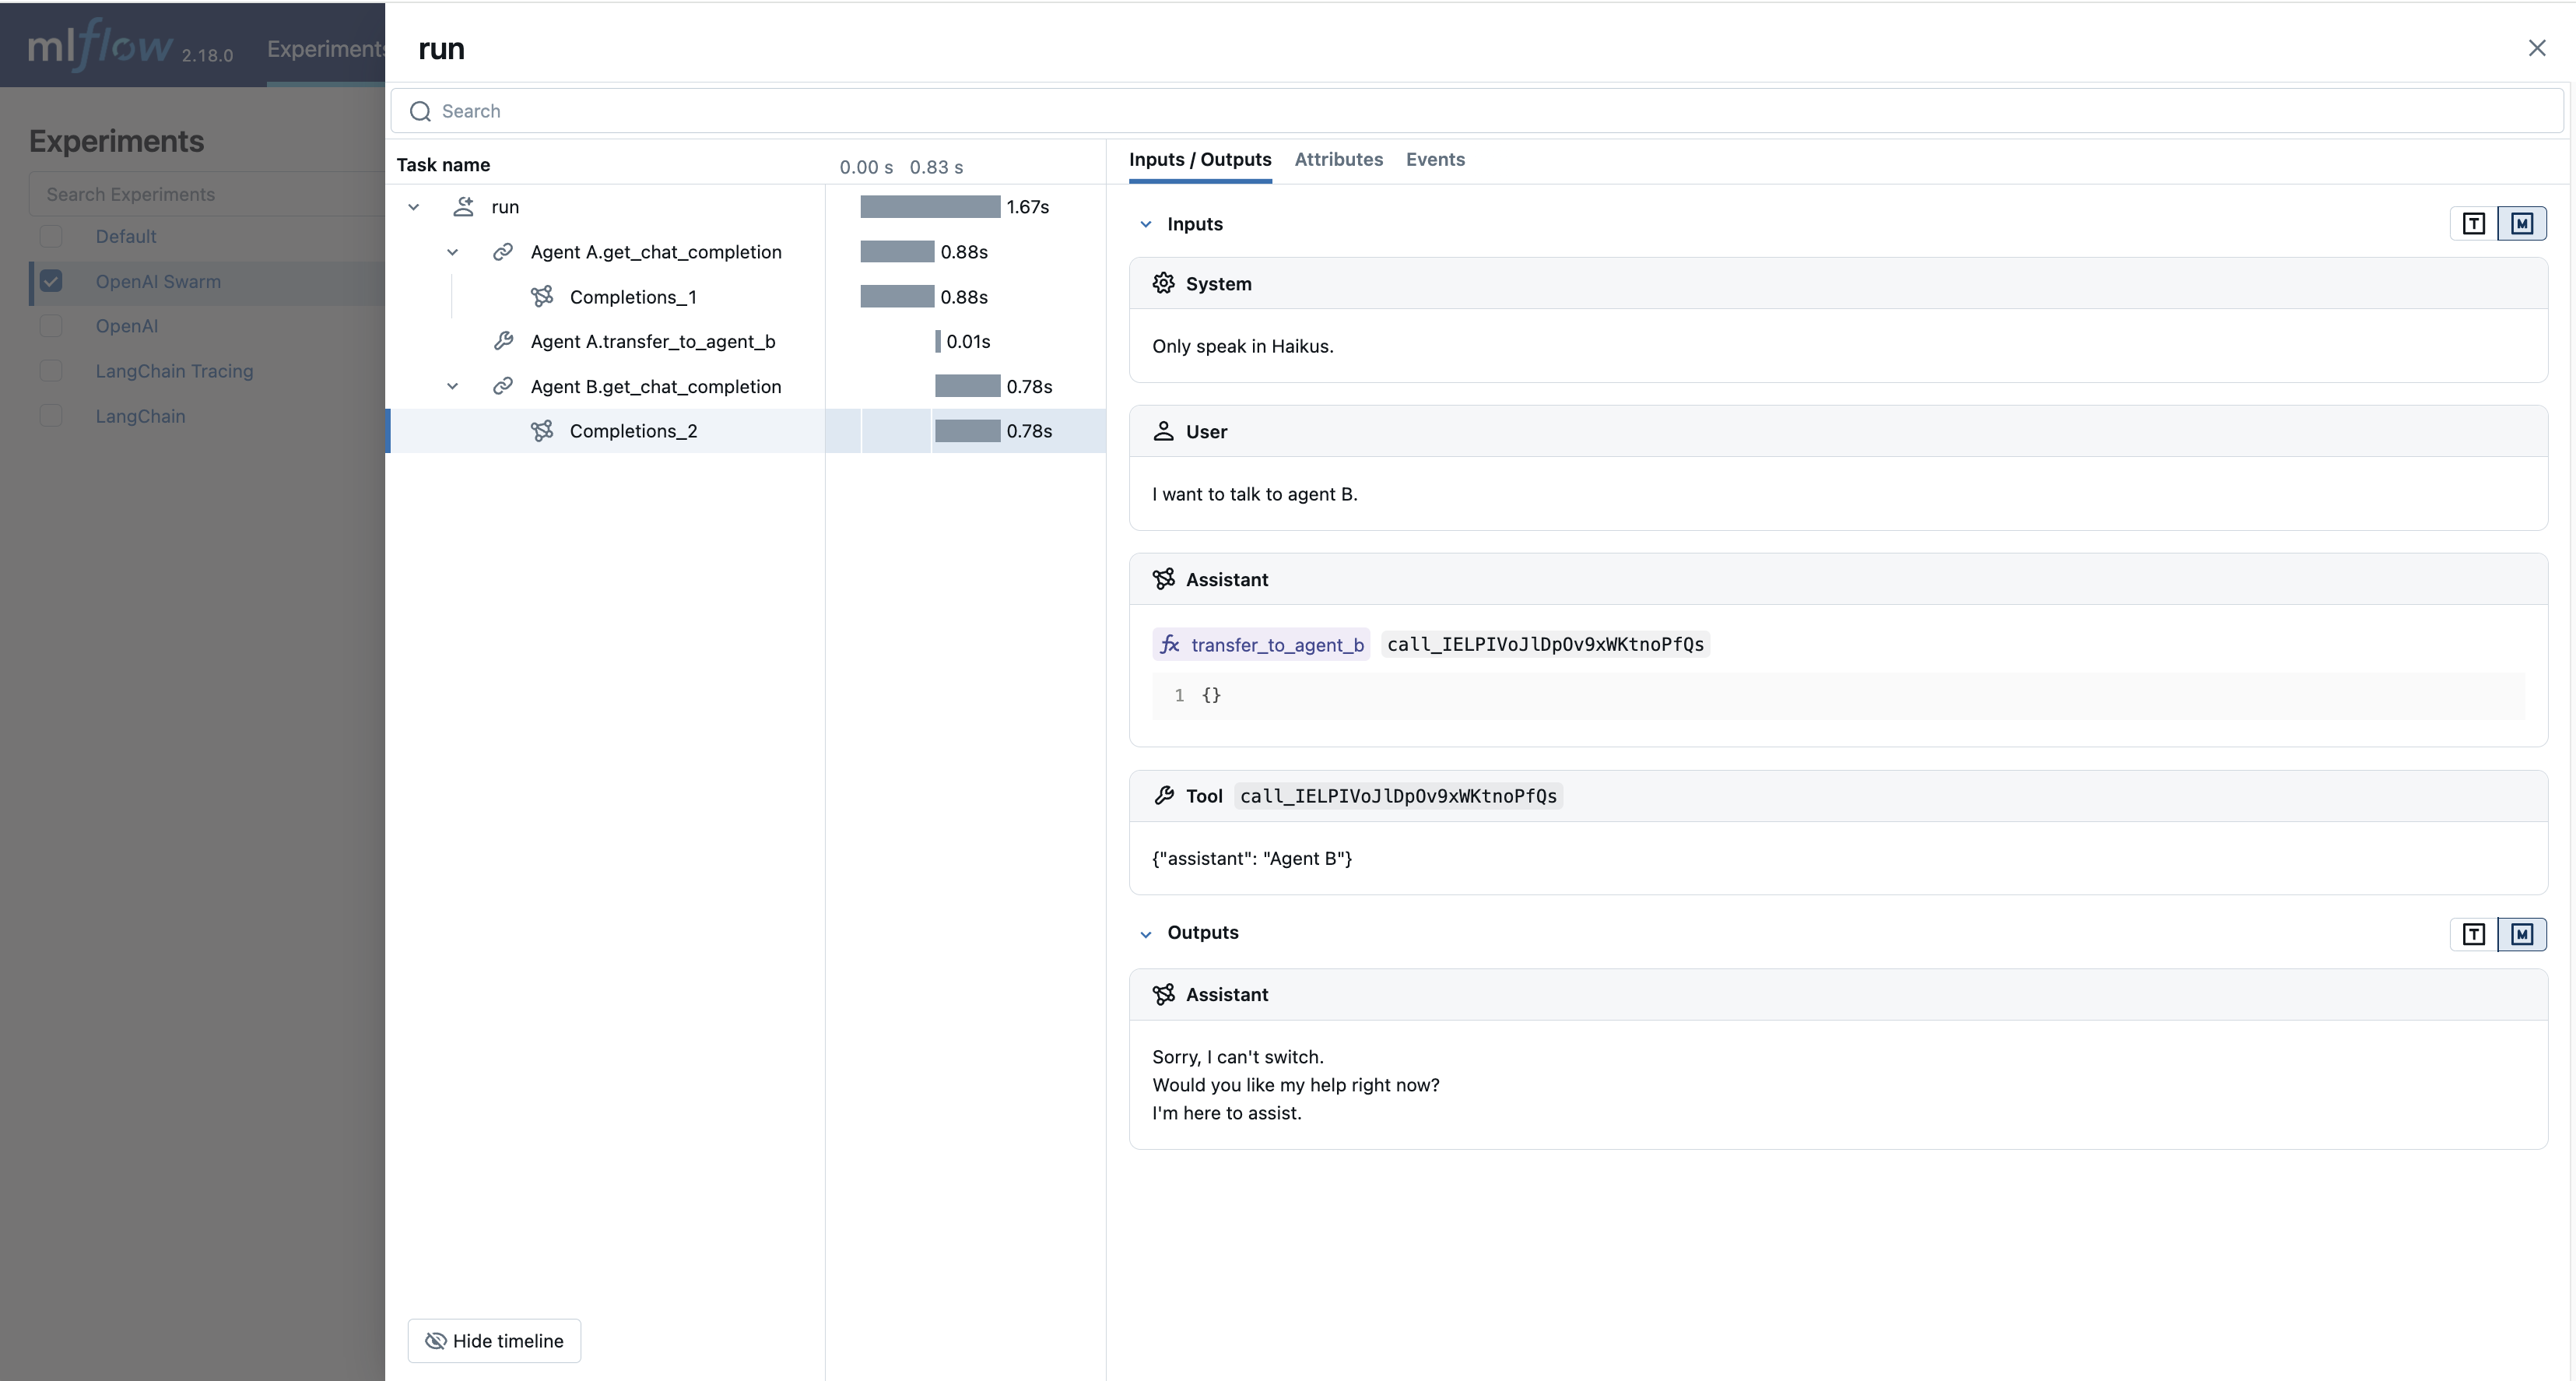
OpenAI Swarm Automatic Tracing
The MLflow OpenAI flavor supports automatic tracing for Swarm, a multi-agent orchestration
framework from OpenAI. To enable tracing for Swarm, just call mlflow.openai.autolog()
before running your multi-agent interactions. MLflow will trace all LLM interactions,
tool calls, and agent operations automatically.
import mlflow

mlflow.openai.autolog()
For example, the code below will run the simplest example of multi-agent interaction using OpenAI Swarm.
import mlflow
from swarm import Swarm, Agent

# Calling the autolog API will enable trace logging by default.
mlflow.openai.autolog()

mlflow.set_experiment("OpenAI Swarm")

client = Swarm()


def transfer_to_agent_b():
    return agent_b


agent_a = Agent(
    name="Agent A",
    instructions="You are a helpful agent.",
    functions=[transfer_to_agent_b],
)

agent_b = Agent(
    name="Agent B",
    instructions="Only speak in Haikus.",
)

response = client.run(
    agent=agent_a,
    messages=[{"role": "user", "content": "I want to talk to agent B."}],
)
print(response)
The logged trace, associated with the OpenAI Swarm experiment, can be seen in the MLflow UI, as shown below:
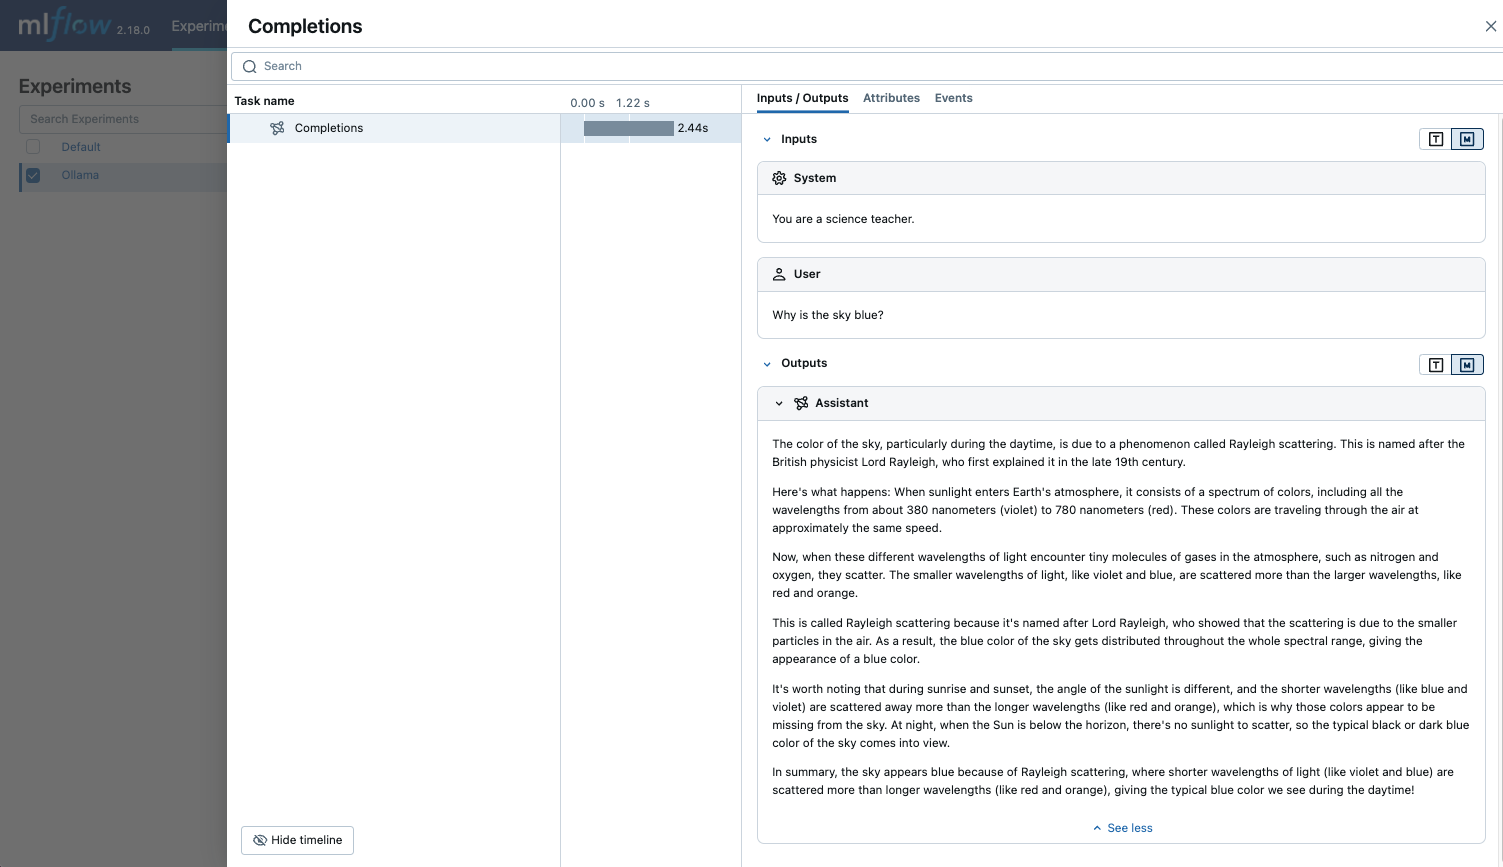
Ollama Automatic Tracing
Ollama is an open-source platform that enables users to run large language models (LLMs) locally on their devices, such as Llama 3.2, Gemma 2, Mistral, Code Llama, and more.
Since the local LLM endpoint served by Ollama is compatible with the OpenAI API, you can query it via OpenAI SDK and enable tracing for Ollama with mlflow.openai.autolog(). Any LLM interactions via Ollama will be recorded to the active MLflow Experiment.
Run the Ollama server with the desired LLM model.
ollama run llama3.2:1b
Enable auto-tracing for OpenAI SDK.
import mlflow

mlflow.openai.autolog()

# Optional, create an experiment to store traces
mlflow.set_experiment("Ollama")
Query the LLM and see the traces in the MLflow UI.
from openai import OpenAI

client = OpenAI(
    base_url="http://localhost:11434/v1",  # The local Ollama REST endpoint
    api_key="dummy",  # Required to instantiate OpenAI client, it can be a random string
)

response = client.chat.completions.create(
    model="llama3.2:1b",
    messages=[
        {"role": "system", "content": "You are a science teacher."},
        {"role": "user", "content": "Why is the sky blue?"},
    ],
)
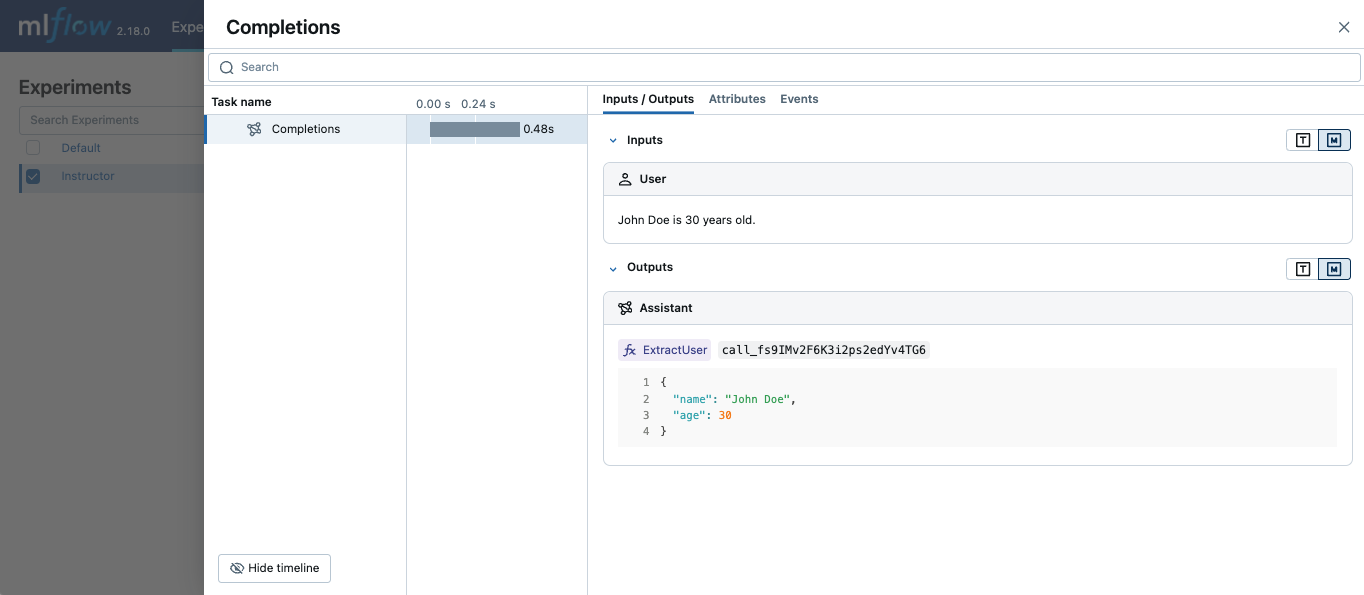
Instructor Automatic Tracing
Instructor is an open-source Python library built on top of Pydantic, simplifying structured LLM outputs with validation, retries, and streaming.
MLflow Tracing works with Instructor by enabling auto-tracing for the underlying LLM libraries.
For example, if you use Instructor for OpenAI LLMs, you can enable tracing with mlflow.openai.autolog() and the generated traces will capture the structured outputs from Instructor.
Similarly, you can also trace Instructor with other LLM providers, such as Anthropic, Gemini, and LiteLLM, by enabling the corresponding autologging in MLflow.
import instructor
from pydantic import BaseModel
from openai import OpenAI

# Use other autologging function e.g., mlflow.anthropic.autolog() if you are using Instructor with different LLM providers
mlflow.openai.autolog()

# Optional, create an experiment to store traces
mlflow.set_experiment("Instructor")


# Use Instructor as usual
class ExtractUser(BaseModel):
    name: str
    age: int


client = instructor.from_openai(OpenAI())

res = client.chat.completions.create(
    model="gpt-4o-mini",
    response_model=ExtractUser,
    messages=[{"role": "user", "content": "John Doe is 30 years old."}],
)
print(f"Name: {res.name}, Age:{res.age}")
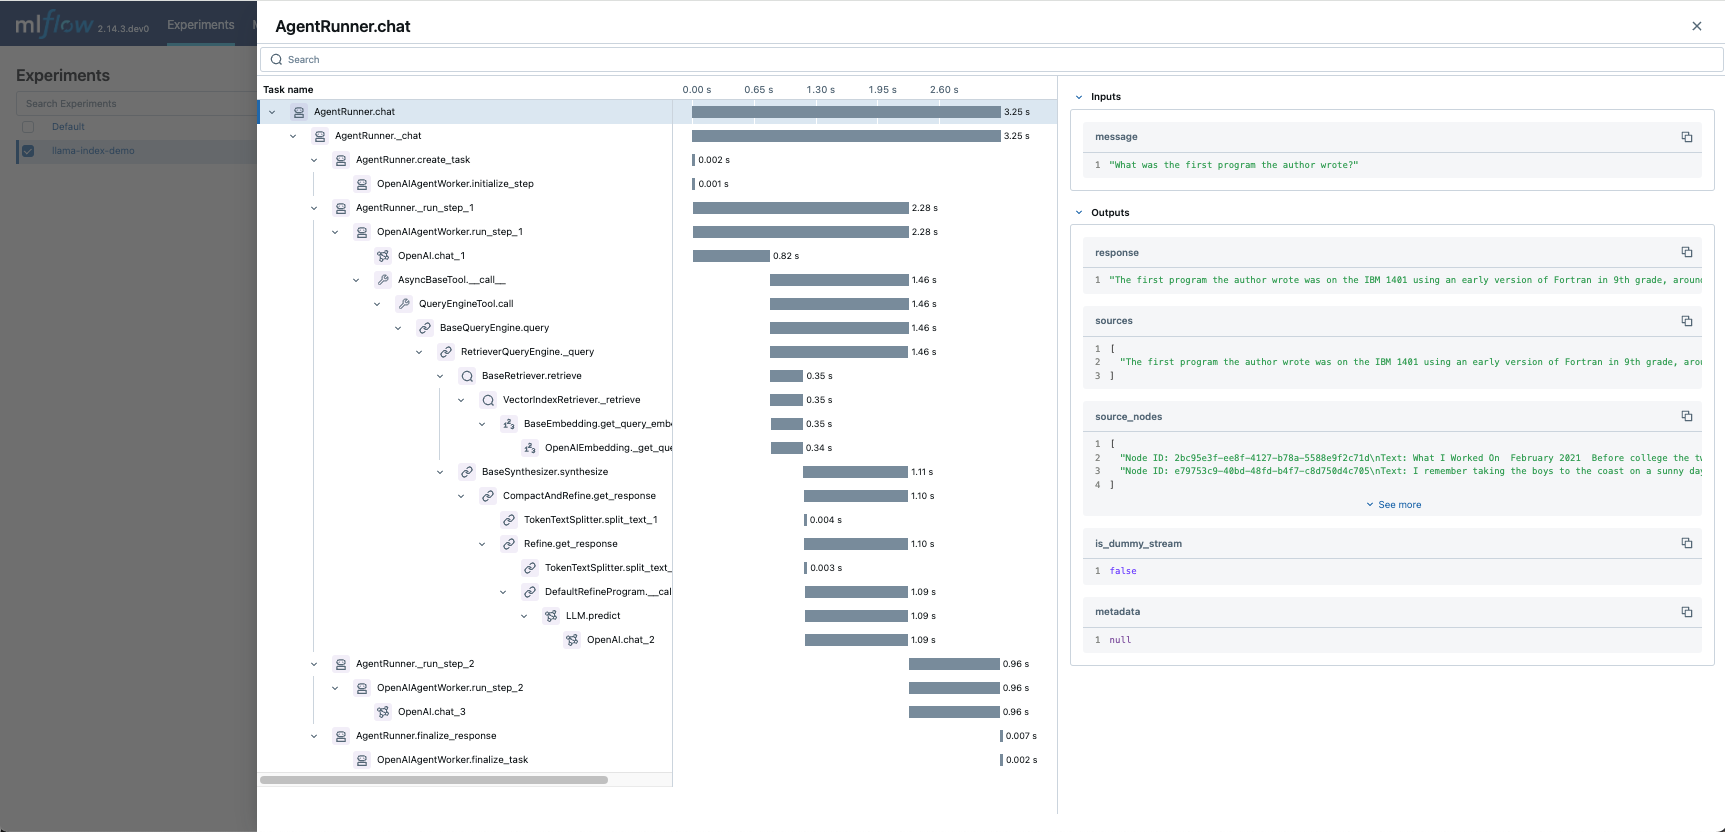
LlamaIndex Automatic Tracing
The MLflow LlamaIndex flavor’s autologging feature has a direct integration with MLflow tracing. When LlamaIndex autologging is enabled with mlflow.llama_index.autolog(), invocation of components
such as LLMs, agents, and query/chat engines will automatically record generated traces during interactive development.
import mlflow

mlflow.llama_index.autolog()
To see the full example of tracing LlamaIndex, please visit LLamaIndex Tracing documentation.
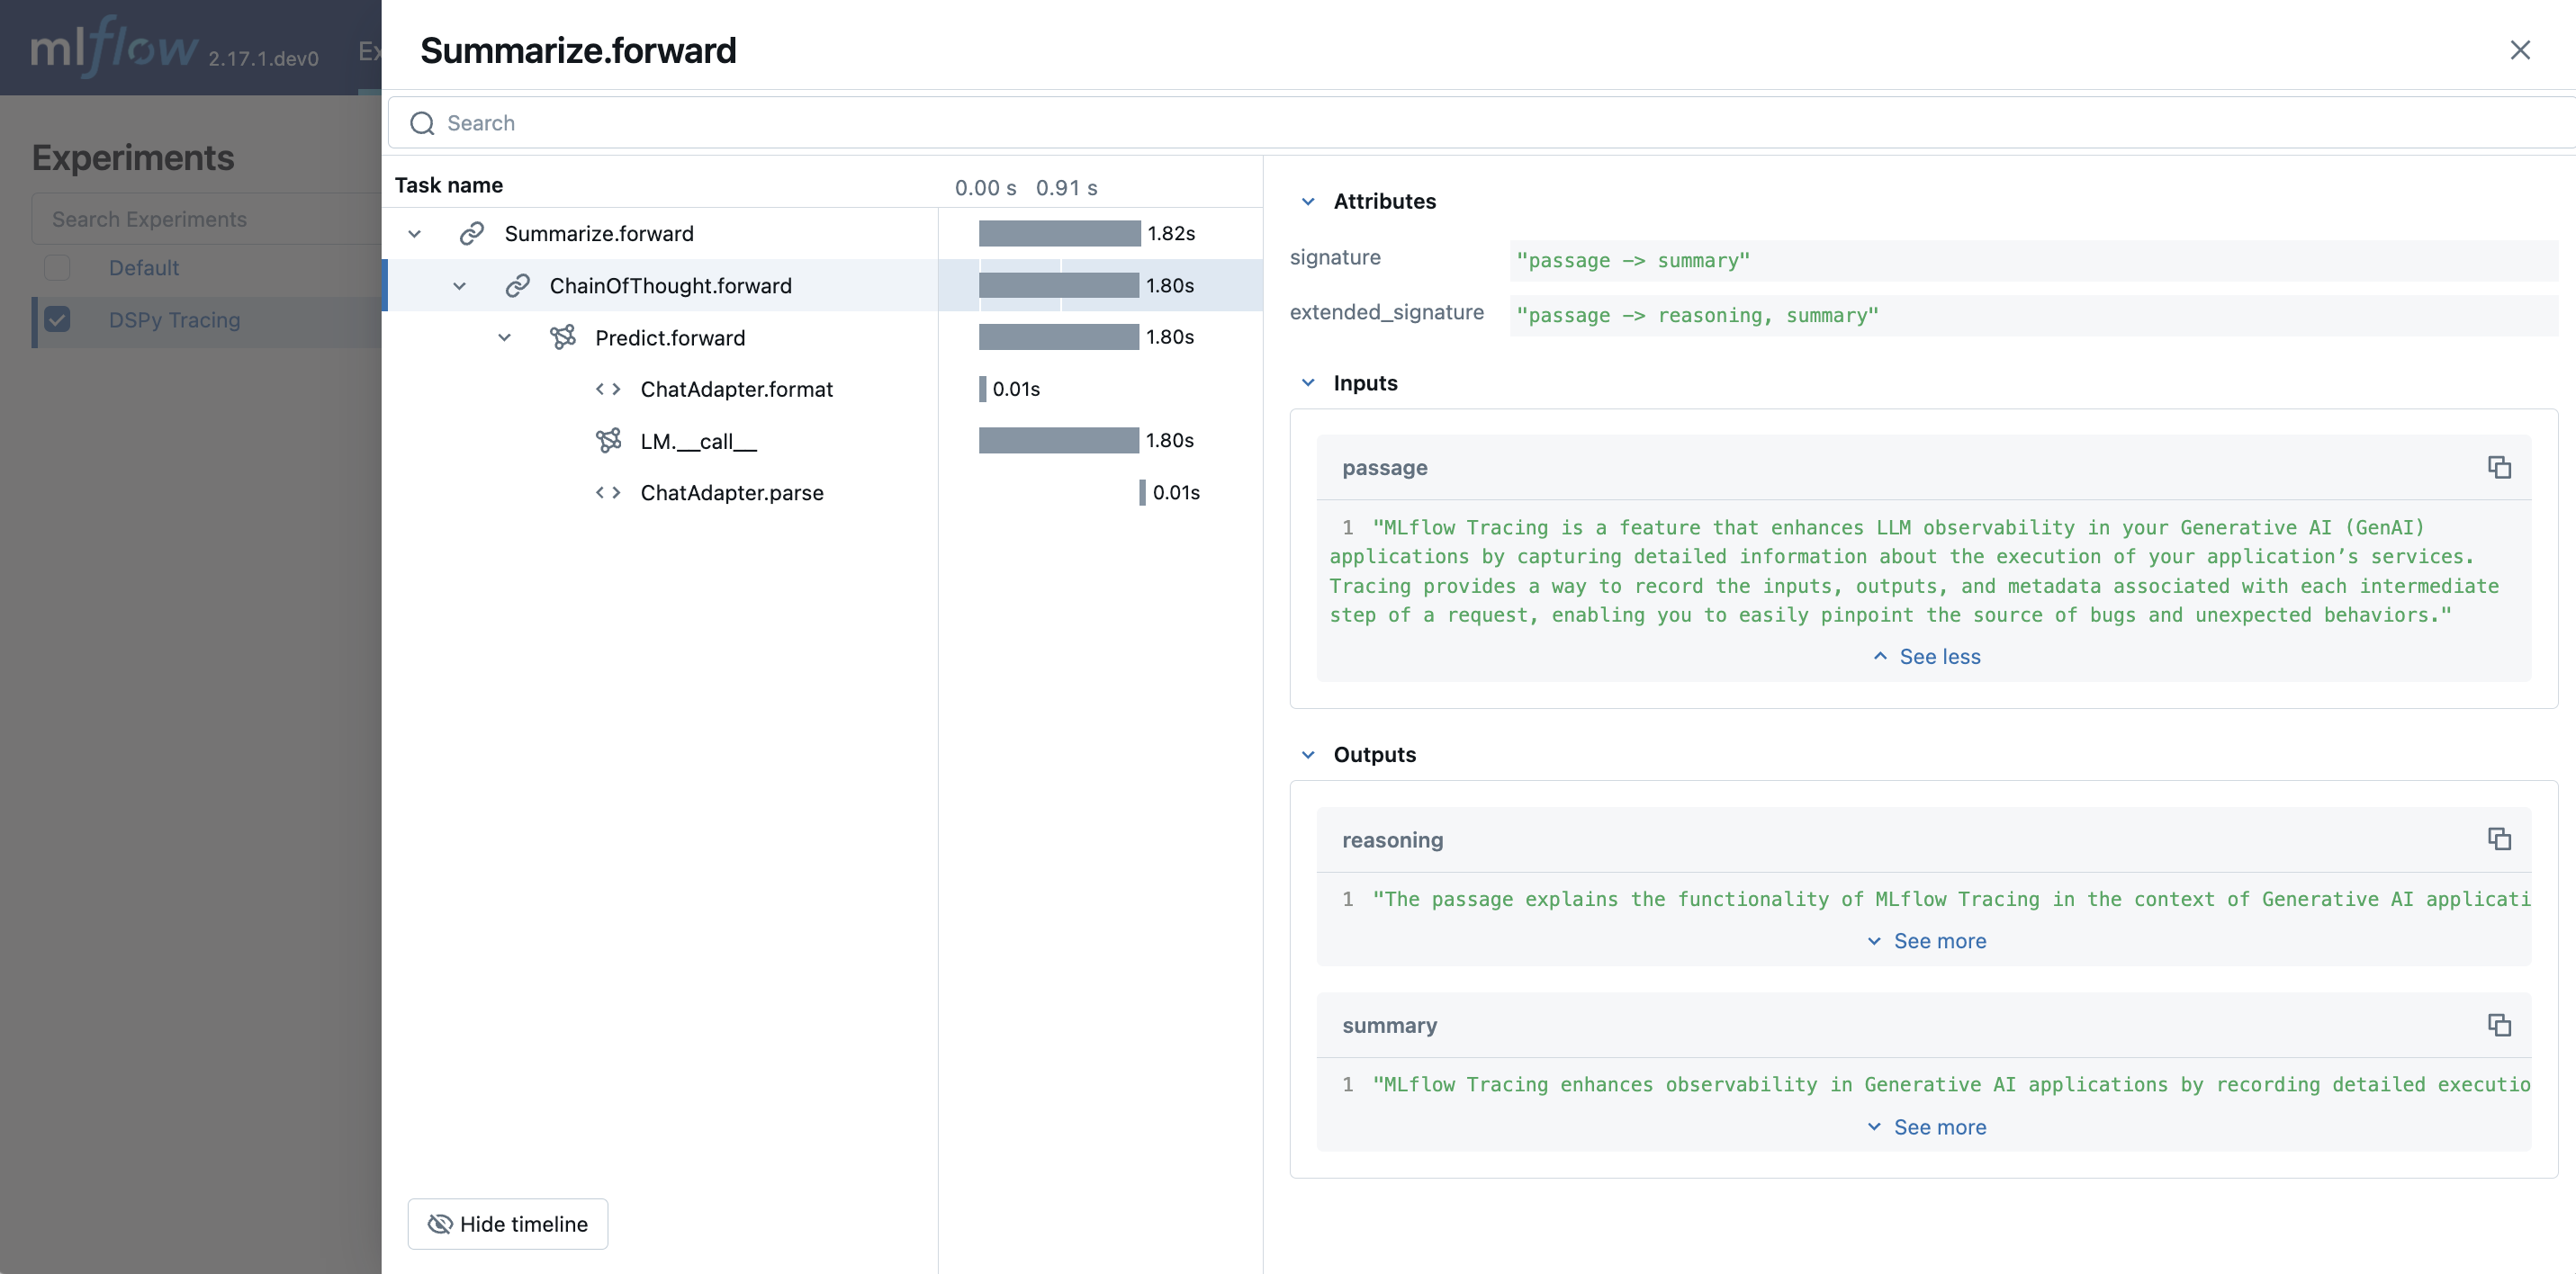
DSPy Automatic Tracing
The MLflow DSPy flavor’s autologging feature has a direct integration with MLflow tracing. When DSPy autologging is enabled with mlflow.dspy.autolog(), invocation of components
such as LMs, Adapters and Modules, will automatically record generated traces during interactive development.
import mlflow
import dspy

# Enable tracing for DSPy
mlflow.dspy.autolog()

# Set an experiment to log the traces to
mlflow.set_experiment("DSPy Tracing")

# Define a simple ChainOfThought model and run it
lm = dspy.LM("openai/gpt-4o-mini")
dspy.configure(lm=lm)


# Define a simple summarizer model and run it
class SummarizeSignature(dspy.Signature):
    """Given a passage, generate a summary."""

    passage: str = dspy.InputField(desc="a passage to summarize")
    summary: str = dspy.OutputField(desc="a one-line summary of the passage")


class Summarize(dspy.Module):
    def __init__(self):
        self.summarize = dspy.ChainOfThought(SummarizeSignature)

    def forward(self, passage: str):
        return self.summarize(passage=passage)


summarizer = Summarize()
summarizer(
    passage=(
        "MLflow Tracing is a feature that enhances LLM observability in your Generative AI (GenAI) applications "
        "by capturing detailed information about the execution of your application's services. Tracing provides "
        "a way to record the inputs, outputs, and metadata associated with each intermediate step of a request, "
        "enabling you to easily pinpoint the source of bugs and unexpected behaviors."
    )
)
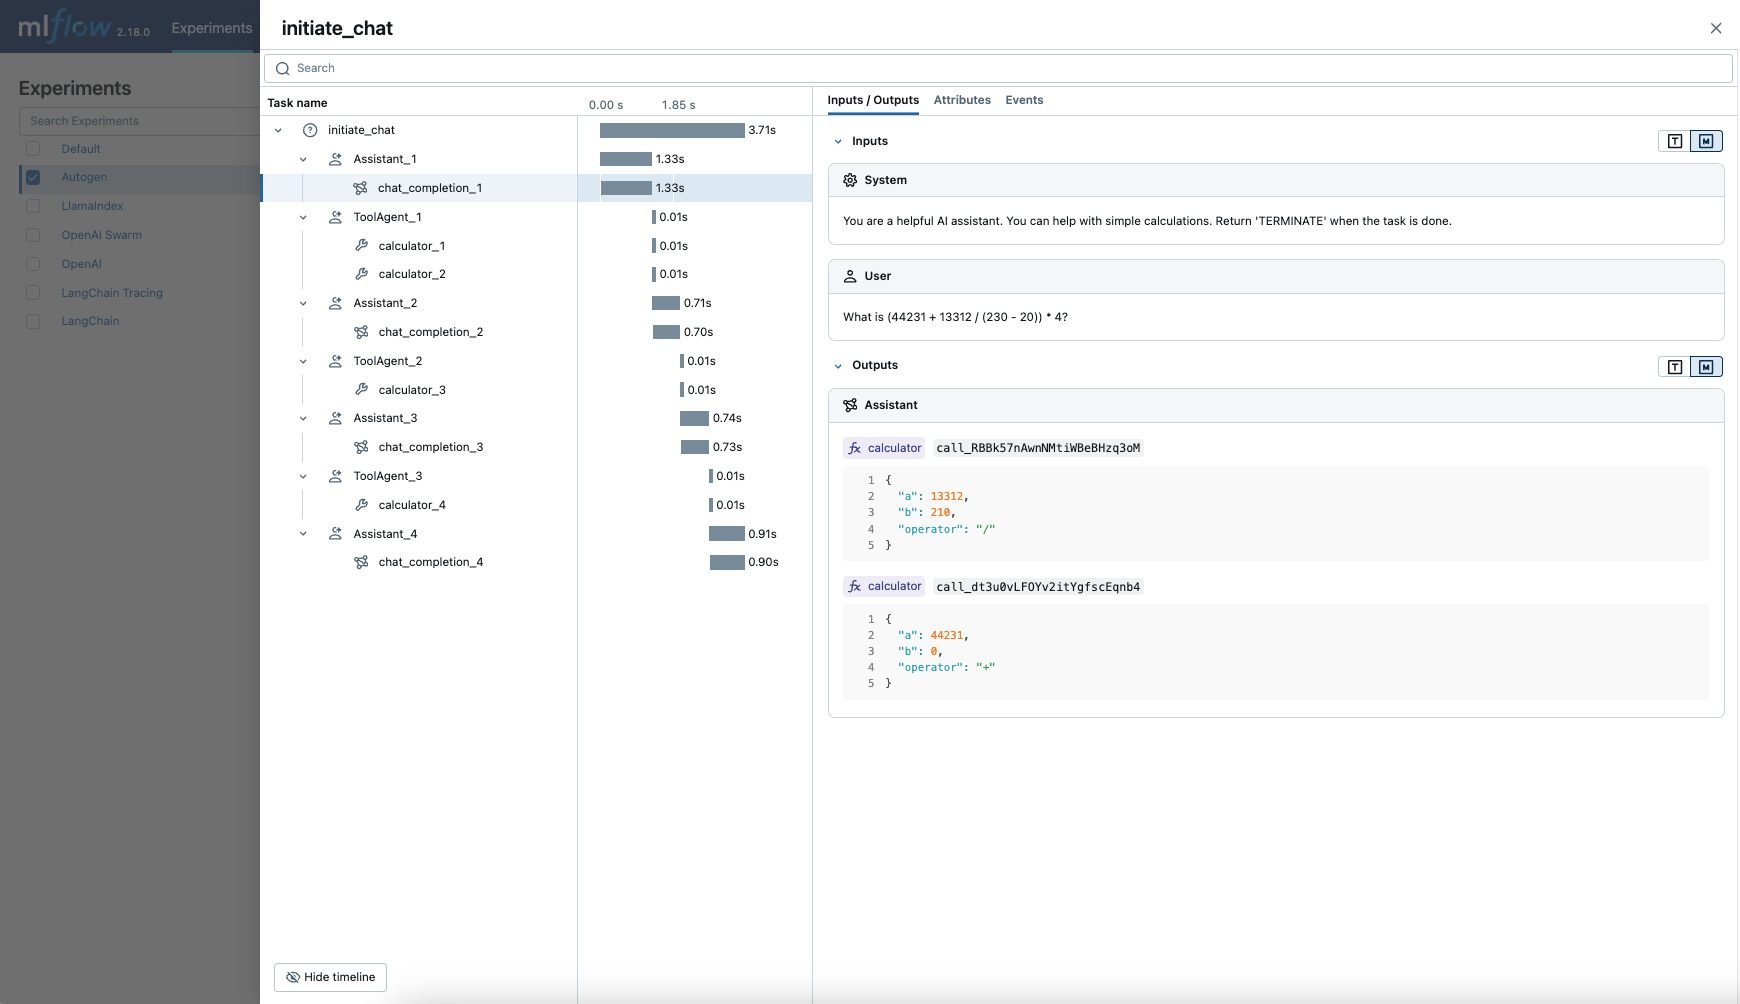
AutoGen Automatic Tracing
MLflow Tracing ensures observability for your AutoGen application that involves complex multi-agent interactions. You can enable auto-tracing by calling mlflow.autogen.autolog(), then the internal steps of the agents chat session will be logged to the active MLflow Experiment.
import mlflow

mlflow.autogen.autolog()
To see the full example of tracing AutoGen, please refer to the AutoGen Tracing example.
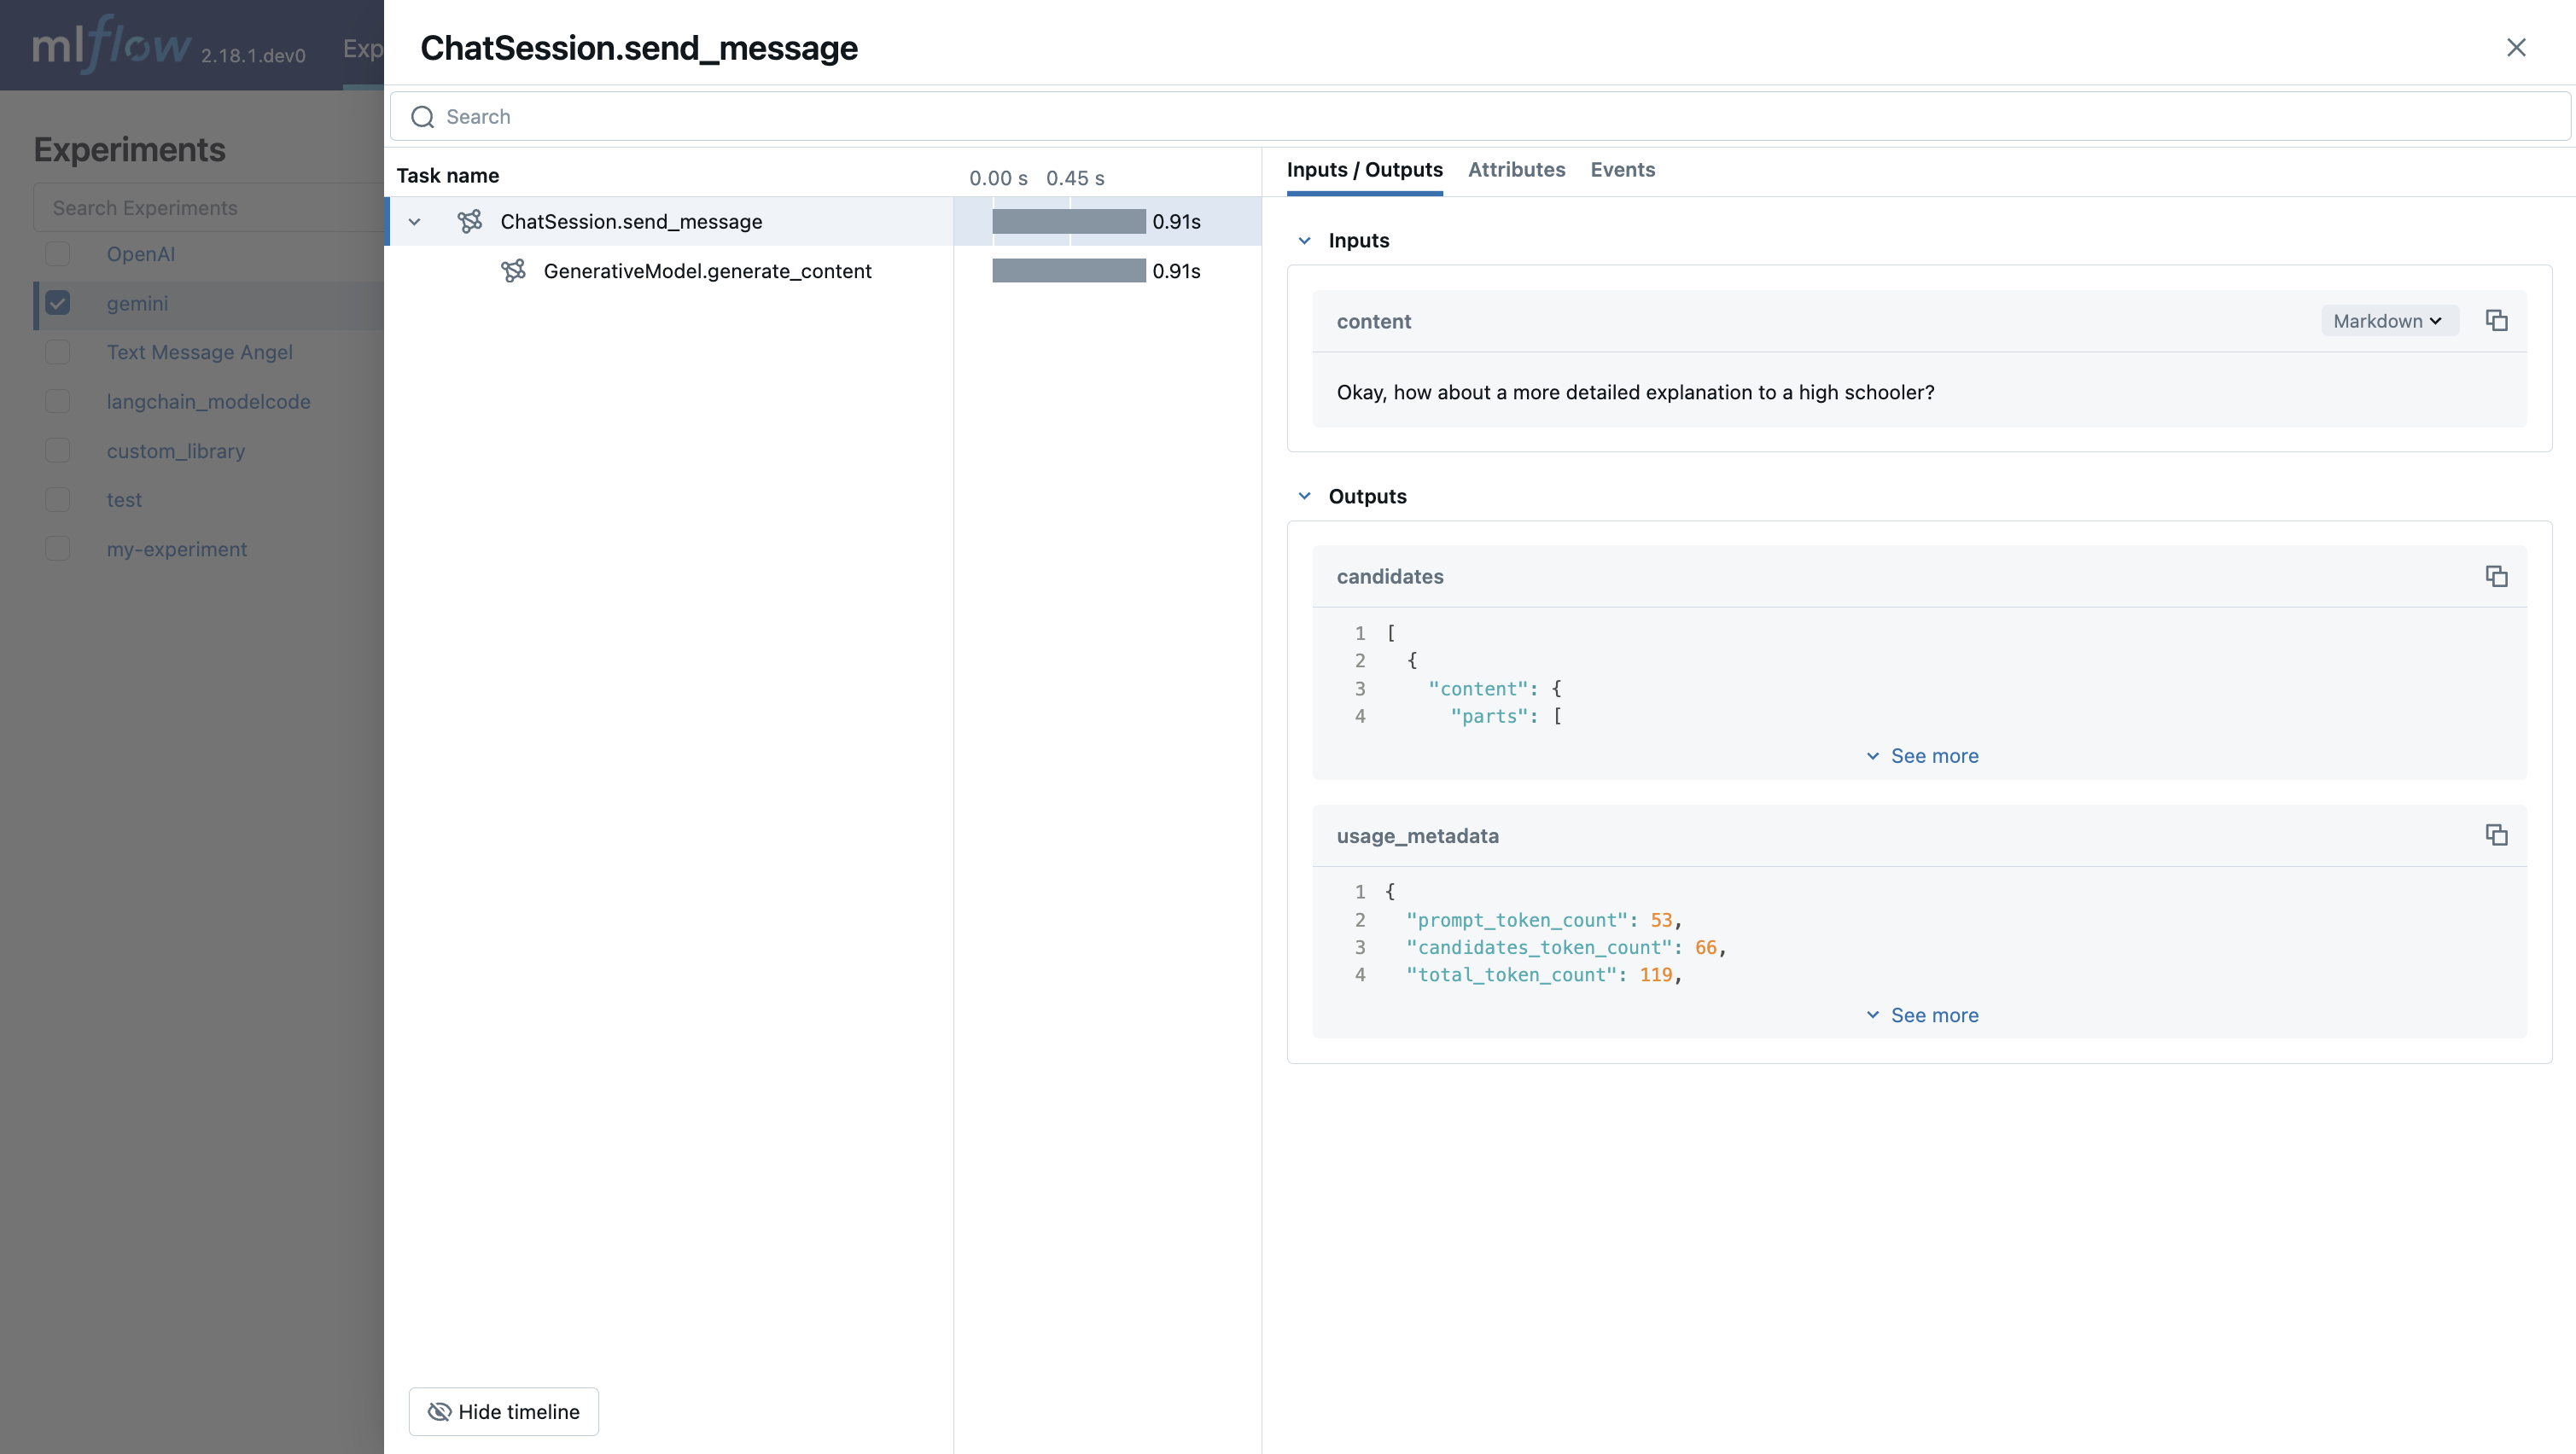
Gemini Automatic Tracing
MLflow Tracing ensures observability for your interactions with Gemini AI models.
When Gemini autologging is enabled with mlflow.gemini.autolog(),
usage of the Gemini SDK will automatically record generated traces during interactive development.
Note that only synchronous calls for text interactions are supported. Asynchronous API is not traced, and full inputs cannnot be recorded for multi-modal inputs.
import mlflow

mlflow.gemini.autolog()
To see the full example of tracing Gemini, please refer to the Gemini Tracing example.
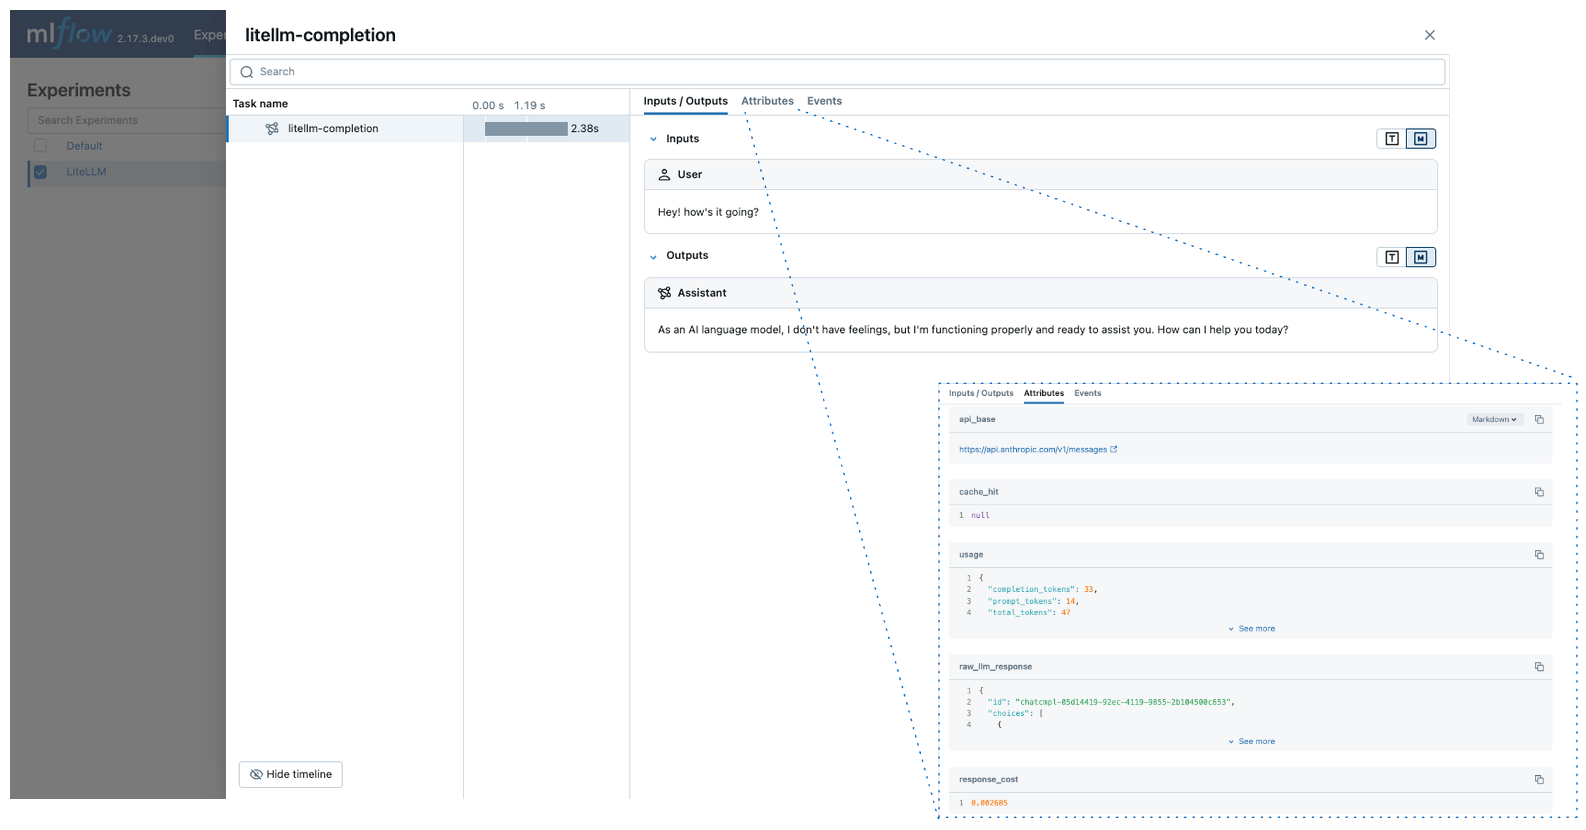
LiteLLM Automatic Tracing
LiteLLM allows developers to call all LLM APIs using the OpenAI format. MLflow support auto-tracing for LiteLLM. You can enable it by calling mlflow.litellm.autolog(), then any LLM interactions via LiteLLM will be recorded to the active MLflow Experiment, including various metadata such as token usage, cost, cache hit, and more.
import mlflow

mlflow.litellm.autolog()

# Call Anthropic API via LiteLLM
response = litellm.completion(
    model="claude-3-opus-20240229",
    messages=[{"role": "system", "content": "Hey! how's it going?"}],
)
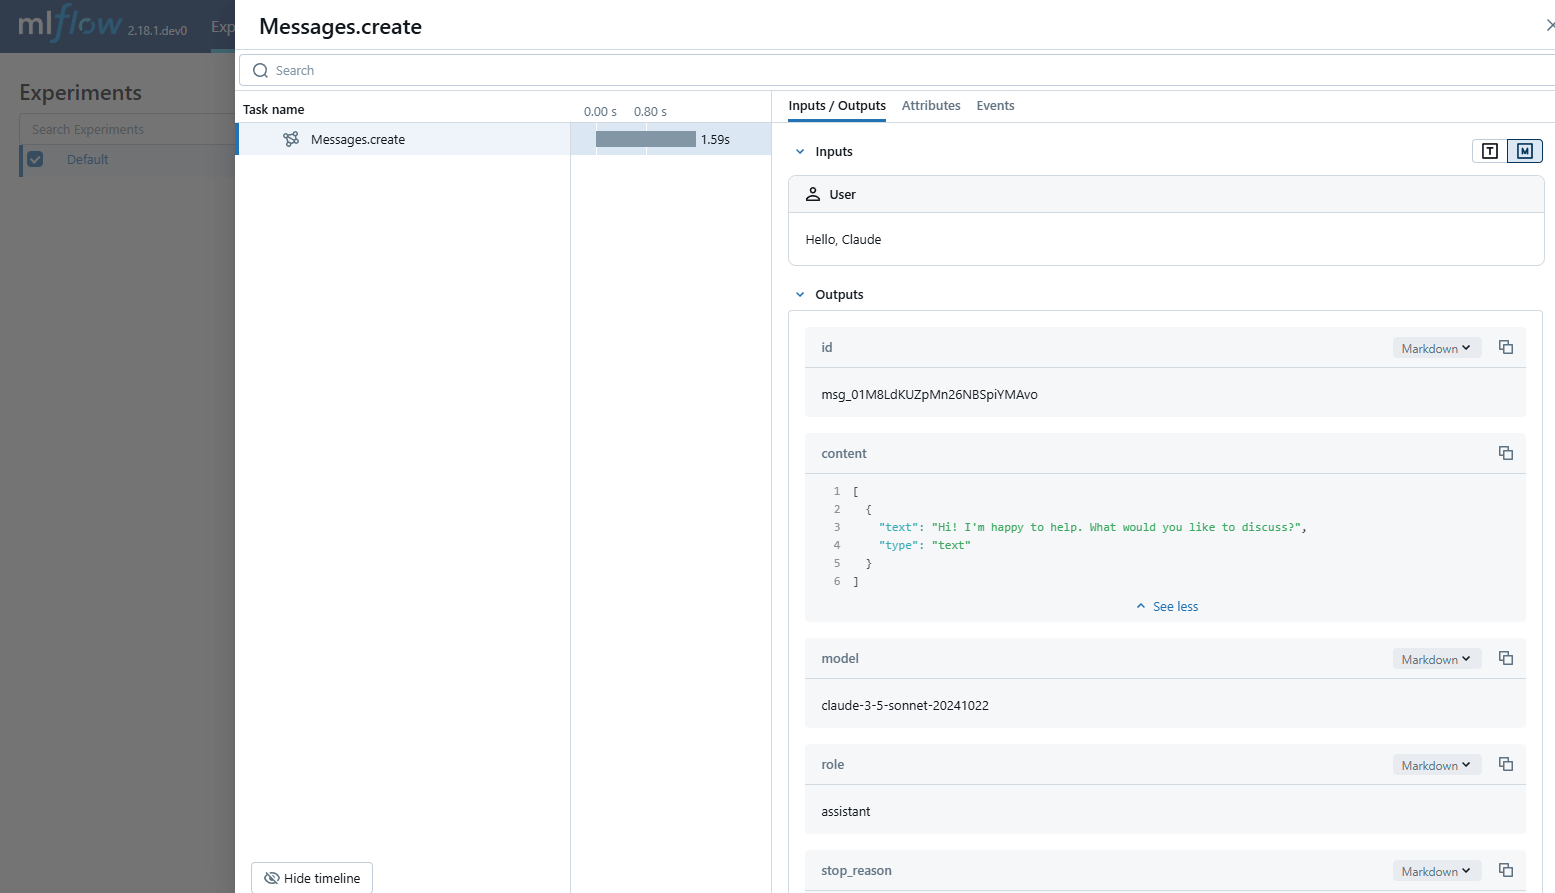
Anthropic Automatic Tracing
MLflow Tracing ensures observability for your interactions with Anthropic AI models.
When Anthropic autologging is enabled with mlflow.anthropic.autolog(),
usage of the Anthropic SDK will automatically record generated traces during interactive development.
Note that only synchronous calls for text interactions are supported.
Asynchronous API and streaming methods are not traced.
import mlflow

mlflow.anthropic.autolog()
To see the full example of tracing Anthropic, please refer to the Anthropic Tracing example.
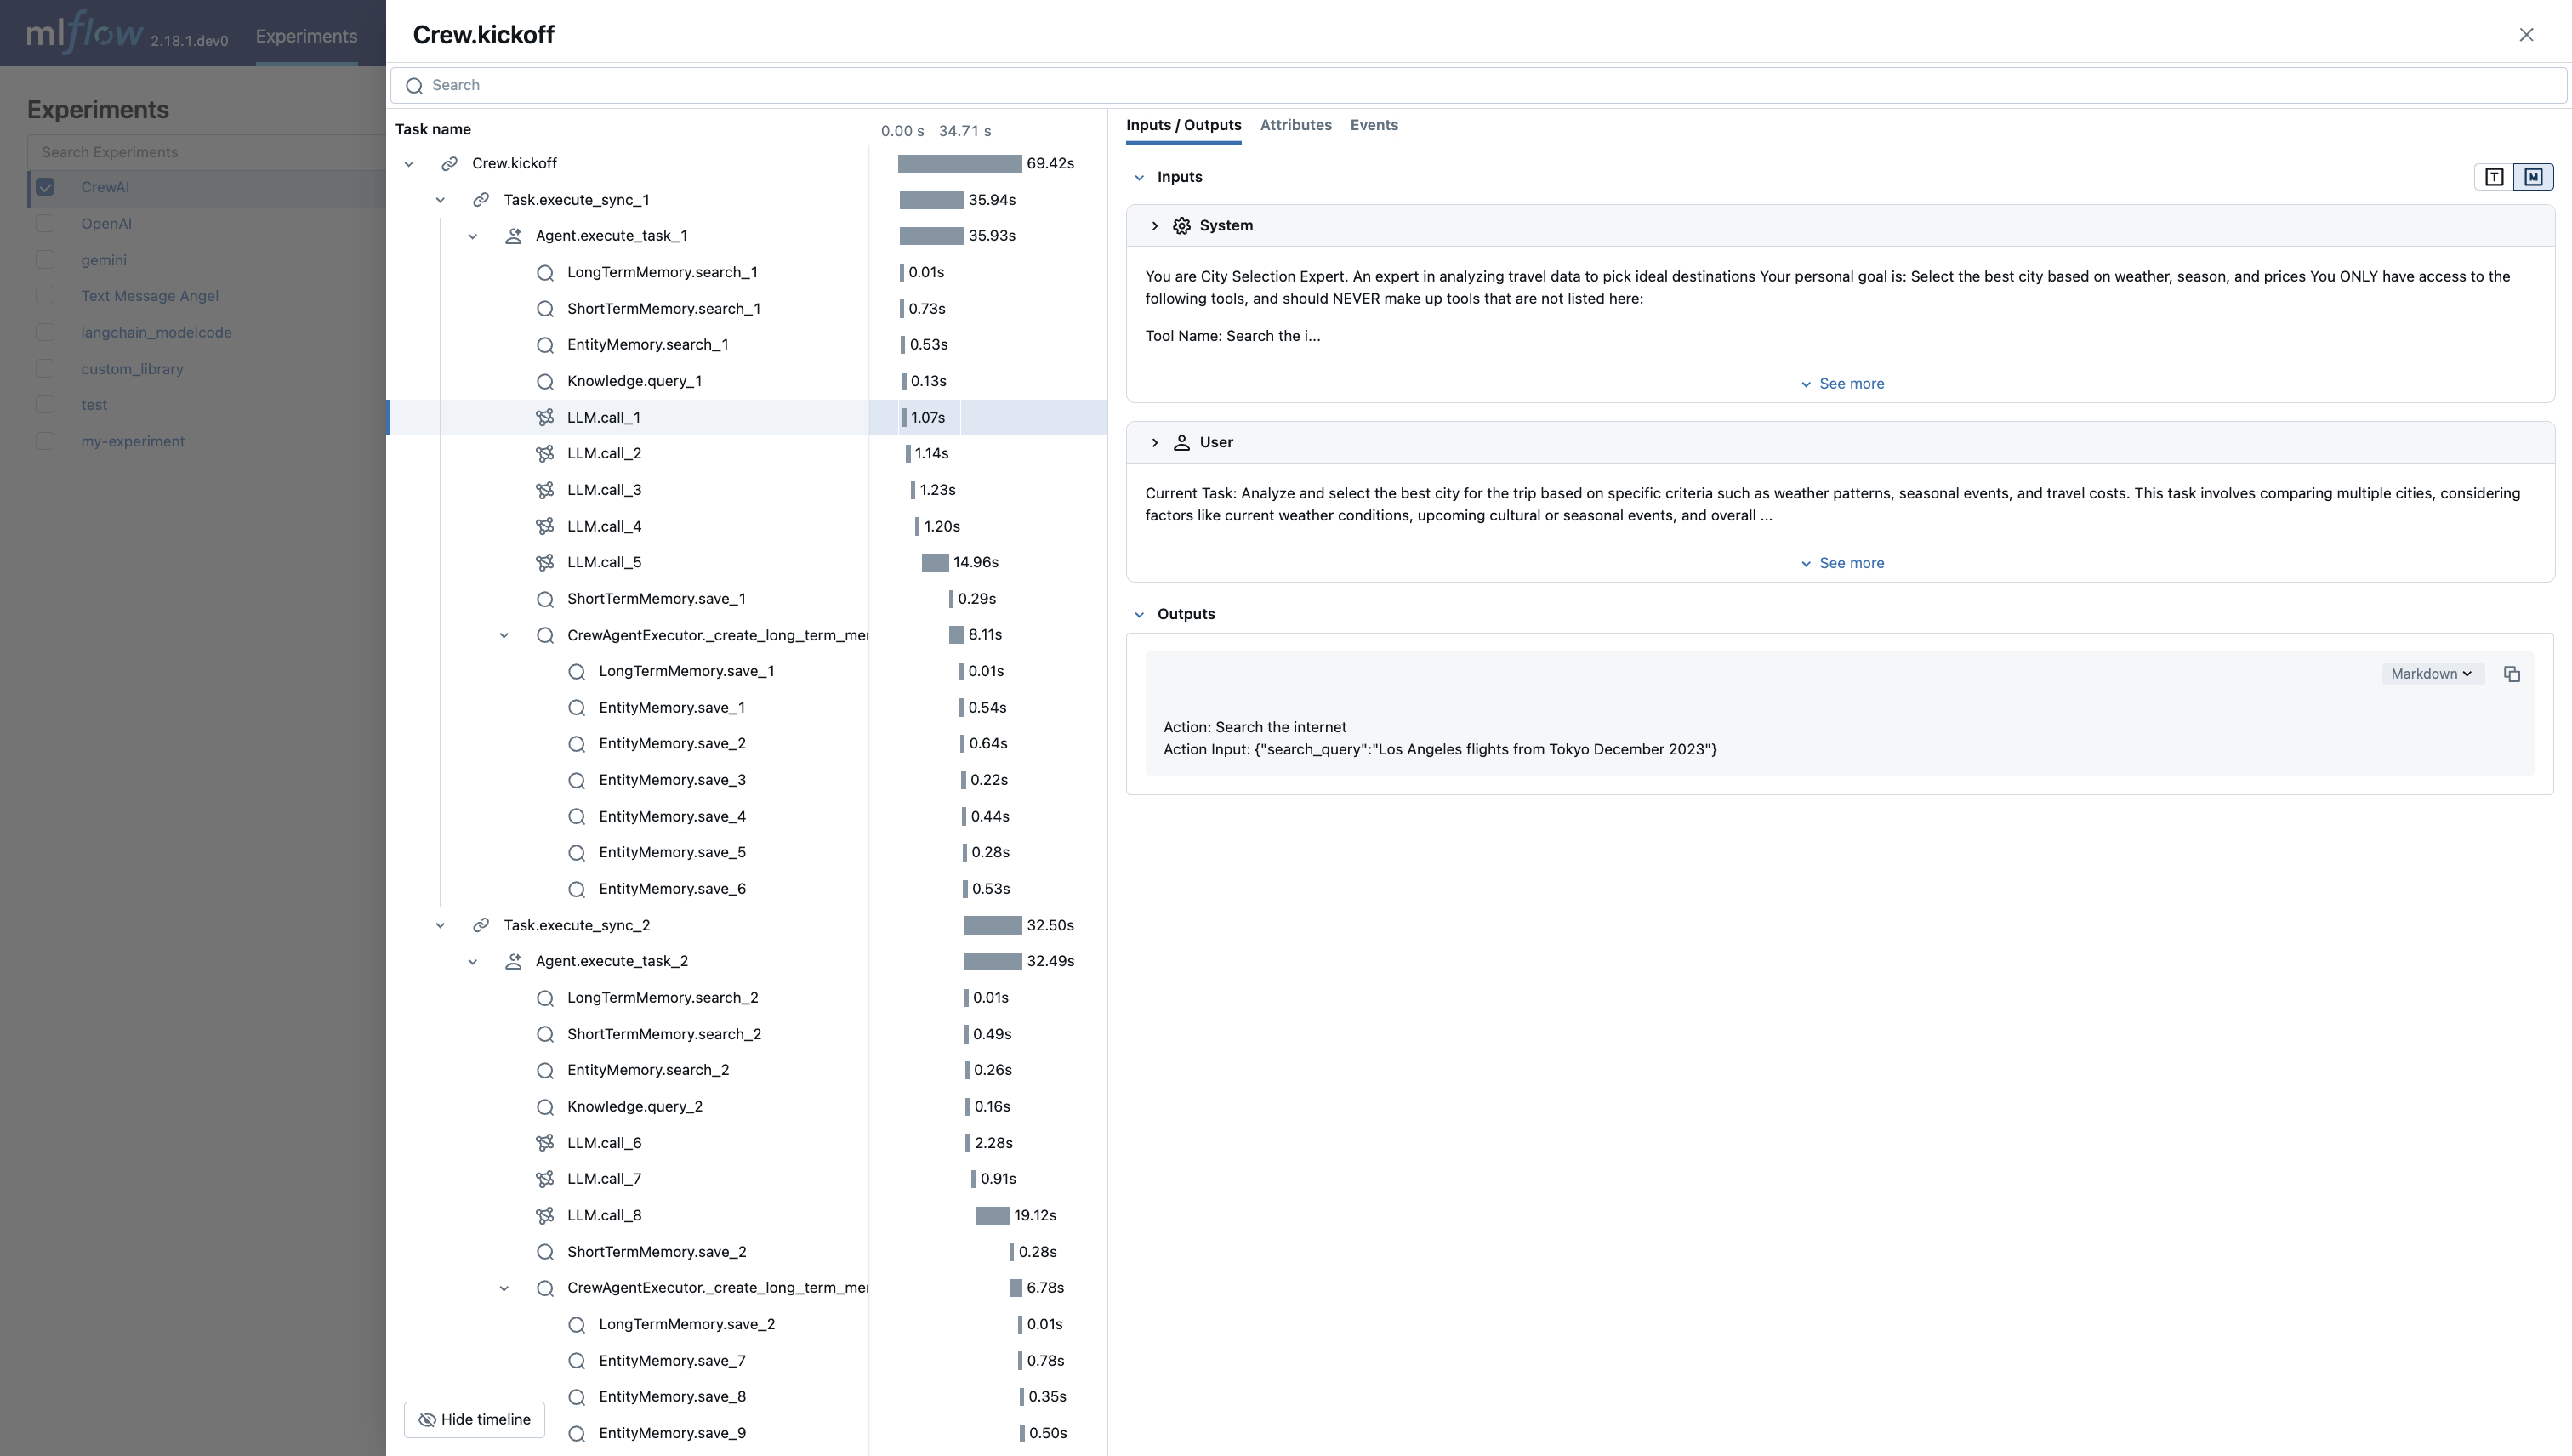
CrewAI Automatic Tracing
MLflow Tracing ensures observability for the interactions of CrewAI agents.
When CrewAI autologging is enabled with mlflow.crewai.autolog(),
traces are generated for the usage of the CrewAI framework.
Note that asynchronous task and kickoff are not supported now.
import mlflow

mlflow.crewai.autolog()
To see the full example of tracing CrewAI, please refer to the CrewAI Tracing example.
Groq Automatic Tracing
MLflow Tracing ensures observability for your interactions with Groq AI models.
When Groq autologging is enabled with mlflow.groq.autolog(),
usage of the Groq SDK will automatically record generated traces during interactive development.
Note that only synchronous calls are supported.
Asynchronous API and streaming methods are not traced.
import mlflow

mlflow.groq.autolog()
To see the full example of tracing Groq, please refer to the Groq Tracing example.
Jupyter Notebook integration
Note
Jupyter integration is available in MLflow 2.20 and above
The trace UI is also available within Jupyter notebooks!
This feature requires using an MLflow Tracking Server, as
this is where the UI assets are fetched from. To get started, simply ensure that the MLflow
Tracking URI is set to your tracking server (e.g. mlflow.set_tracking_uri("http://localhost:5000")).
By default, the trace UI will automatically be displayed for the following events:
When the cell code generates a trace (e.g. via automatic tracing, or by running a manually traced function)
When
mlflow.search_traces()is calledWhen a
mlflow.entities.Traceobject is displayed (e.g. via IPython’sdisplayfunction, or when it is the last value returned in a cell)
To disable the display, simply call mlflow.tracing.disable_notebook_display(), and rerun the cell
containing the UI. To enable it again, call mlflow.tracing.enable_notebook_display().
For a more complete example, try running this demo notebook!
Tracing Fluent APIs
MLflow’s fluent APIs provide a straightforward way to add tracing to your functions and code blocks.
By using decorators, function wrappers, and context managers, you can easily capture detailed trace data with minimal code changes.
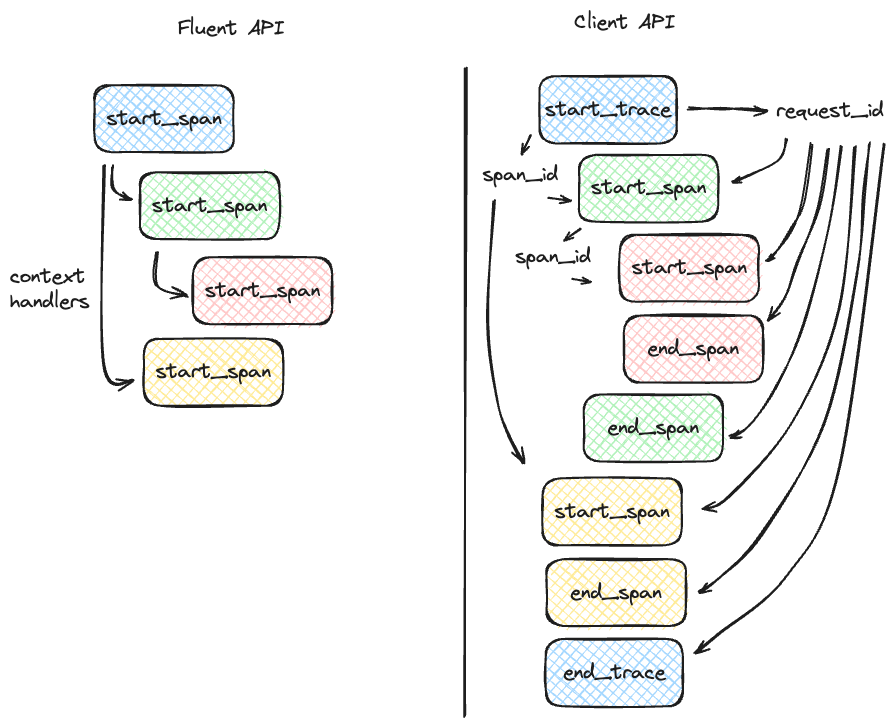
As a comparison between the fluent and the client APIs for tracing, the figure below illustrates the differences in complexity between the two APIs, with the fluent API being more concise and the recommended approach if your tracing use case can support using the higher-level APIs.
This section will cover how to initiate traces using these fluent APIs.
Initiating a Trace
In this section, we will explore different methods to initiate a trace using MLflow’s fluent APIs. These methods allow you to add tracing functionality to your code with minimal modifications, enabling you to capture detailed information about the execution of your functions and workflows.
Trace Decorator
The trace decorator allows you to automatically capture the inputs and outputs of a function by simply adding the @mlflow.trace decorator
to its definition. This approach is ideal for quickly adding tracing to individual functions without significant changes to your existing code.
import mlflow

# Create a new experiment to log the trace to
mlflow.set_experiment("Tracing Demo")


# Mark any function with the trace decorator to automatically capture input(s) and output(s)
@mlflow.trace
def some_function(x, y, z=2):
    return x + (y - z)


# Invoking the function will generate a trace that is logged to the active experiment
some_function(2, 4)
You can add additional metadata to the tracing decorator as follows:
@mlflow.trace(name="My Span", span_type="func", attributes={"a": 1, "b": 2})
def my_func(x, y):
    return x + y
When adding additional metadata to the trace decorator constructor, these additional components will be logged along with the span entry within the trace that is stored within the active MLflow experiment.
Since MLflow 2.16.0, the trace decorator also supports async functions:
from openai import AsyncOpenAI

client = AsyncOpenAI()


@mlflow.trace
async def async_func(message: str):
    return await client.chat.completion.create(
        model="gpt-4o", messages=[{"role": "user", "content": message}]
    )


await async_func("What is MLflow Tracing?")
What is captured?
If we navigate to the MLflow UI, we can see that the trace decorator automatically captured the following information, in addition to the basic metadata associated with any span (start time, end time, status, etc):
Inputs: In the case of our decorated function, this includes the state of all input arguments (including the default z value that is applied).
Response: The output of the function is also captured, in this case the result of the addition and subtraction operations.
Trace Name: The name of the decorated function.
Error Handling with Traces
If an Exception is raised during processing of a trace-instrumented operation, an indication will be shown within the UI that the invocation was not
successful and a partial capture of data will be available to aid in debugging. Additionally, details about the Exception that was raised will be included
within Events of the partially completed span, further aiding the identification of where issues are occurring within your code.
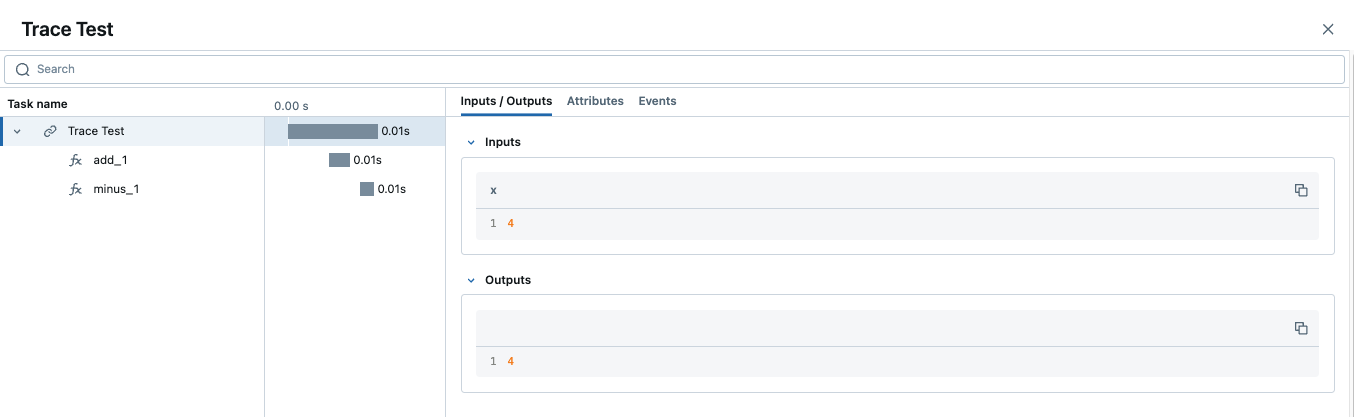
Parent-child relationships
When using the trace decorator, each decorated function will be treated as a separate span within the trace. The relationship between dependent function calls is handled directly through the native call excecution order within Python. For example, the following code will introduce two “child” spans to the main parent span, all using decorators.
import mlflow


@mlflow.trace(span_type="func", attributes={"key": "value"})
def add_1(x):
    return x + 1


@mlflow.trace(span_type="func", attributes={"key1": "value1"})
def minus_1(x):
    return x - 1


@mlflow.trace(name="Trace Test")
def trace_test(x):
    step1 = add_1(x)
    return minus_1(step1)


trace_test(4)
If we look at this trace from within the MLflow UI, we can see the relationship of the call order shown in the structure of the trace.
Span Type
Span types are a way to categorize spans within a trace. By default, the span type is set to "UNKNOWN" when using the trace decorator. MLflow provides a set of predefined span types for common use cases, while also allowing you to setting custom span types.
The following span types are available:
Span Type |
Description |
|---|---|
|
Represents a call to an LLM endpoint or a local model. |
|
Represents a query to a chat model. This is a special case of an LLM interaction. |
|
Represents a chain of operations. |
|
Represents an autonomous agent operation. |
|
Represents a tool execution (typically by an agent), such as querying a search engine. |
|
Represents a text embedding operation. |
|
Represents a context retrieval operation, such as querying a vector database. |
|
Represents a parsing operation, transforming text into a structured format. |
|
Represents a re-ranking operation, ordering the retrieved contexts based on relevance. |
|
A default span type that is used when no other span type is specified. |
To set a span type, you can pass the span_type parameter to the @mlflow.trace decorator or mlflow.start_span context manager. When you are using automatic tracing, the span type is automatically set by MLflow.
import mlflow
from mlflow.entities import SpanType


# Using a built-in span type
@mlflow.trace(span_type=SpanType.RETRIEVER)
def retrieve_documents(query: str):
    ...


# Setting a custom span type
with mlflow.start_span(name="add", span_type="MATH") as span:
    span.set_inputs({"x": z, "y": y})
    z = x + y
    span.set_outputs({"z": z})

    print(span.span_type)
    # Output: MATH
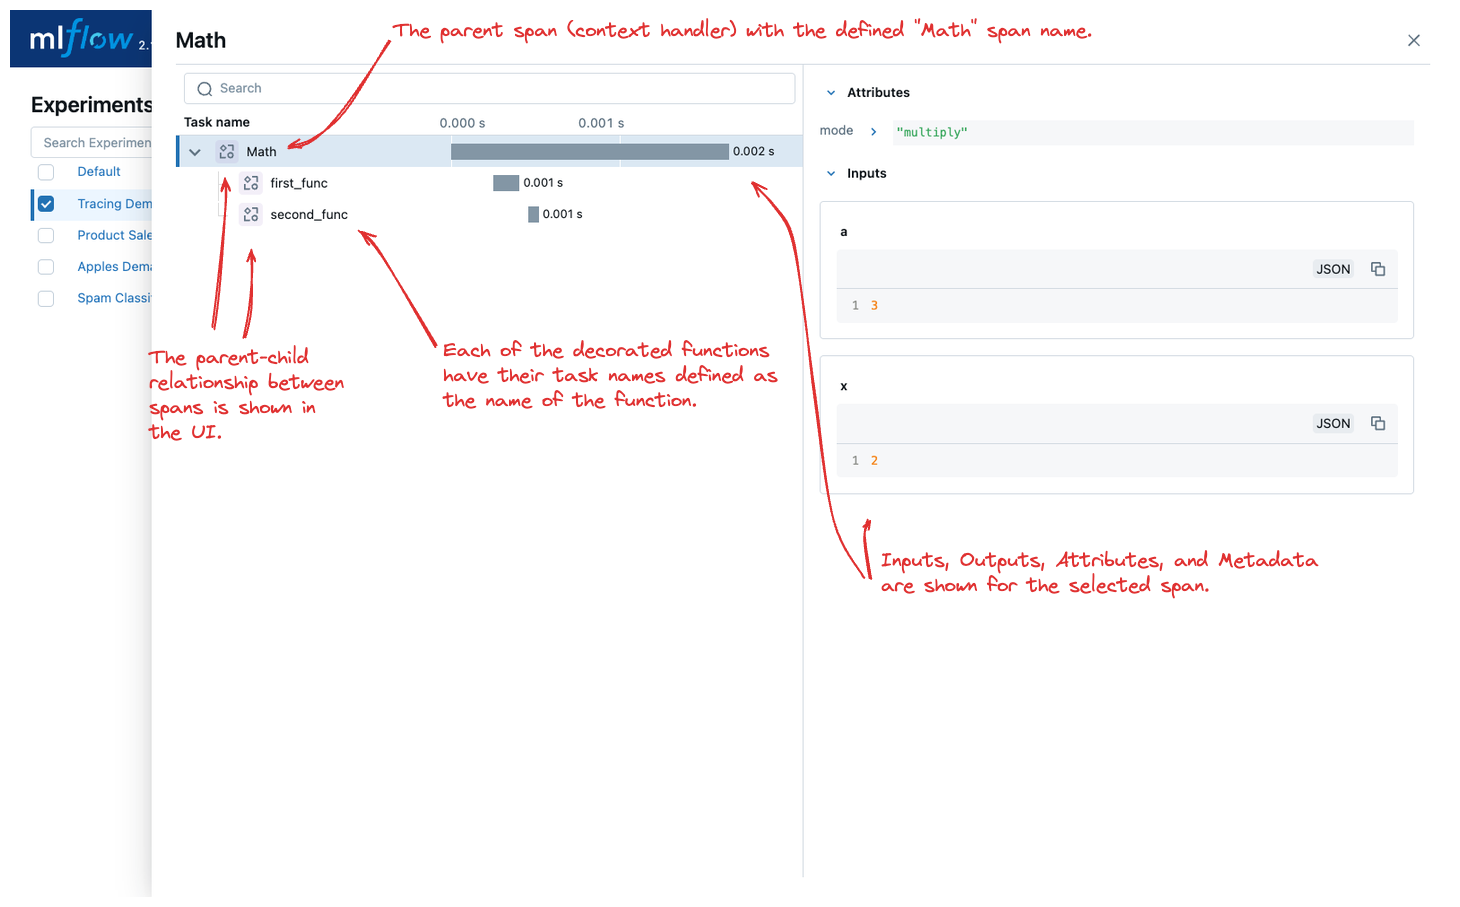
Context Handler
The context handler provides a way to create nested traces or spans, which can be useful for capturing complex interactions within your code.
By using the mlflow.start_span() context manager, you can group multiple traced functions under a single parent span, making it easier to understand
the relationships between different parts of your code.
The context handler is recommended when you need to refine the scope of data capture for a given span. If your code is logically constructed such that individual calls to services or models are contained within functions or methods, on the other hand, using the decorator approach is more straight-forward and less complex.
import mlflow


@mlflow.trace
def first_func(x, y=2):
    return x + y


@mlflow.trace
def second_func(a, b=3):
    return a * b


def do_math(a, x, operation="add"):
    # Use the fluent API context handler to create a new span
    with mlflow.start_span(name="Math") as span:
        # Specify the inputs and attributes that will be associated with the span
        span.set_inputs({"a": a, "x": x})
        span.set_attributes({"mode": operation})

        # Both of these functions are decorated for tracing and will be associated
        # as 'children' of the parent 'span' defined with the context handler
        first = first_func(x)
        second = second_func(a)

        result = None

        if operation == "add":
            result = first + second
        elif operation == "subtract":
            result = first - second
        else:
            raise ValueError(f"Unsupported Operation Mode: {operation}")

        # Specify the output result to the span
        span.set_outputs({"result": result})

        return result
When calling the do_math function, a trace will be generated that has the root span (parent) defined as the
context handler with mlflow.start_span(): call. The first_func and second_func calls will be associated as child spans
to this parent span due to the fact that they are both decorated functions (having @mlflow.trace decorated on the function definition).
Running the following code will generate a trace.
do_math(8, 3, "add")
This trace can be seen within the MLflow UI:
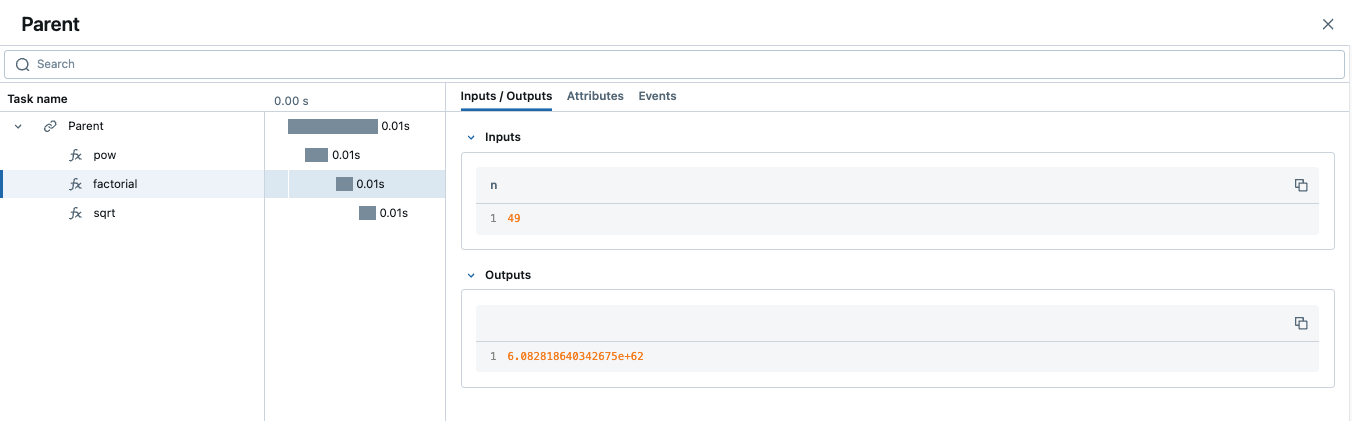
Function wrapping
Function wrapping provides a flexible way to add tracing to existing functions without modifying their definitions. This is particularly useful when
you want to add tracing to third-party functions or functions defined outside of your control. By wrapping an external function with mlflow.trace(), you can
capture its inputs, outputs, and execution context.
import math

import mlflow

mlflow.set_experiment("External Function Tracing")


def invocation(x, y=4, exp=2):
    # Initiate a context handler for parent logging
    with mlflow.start_span(name="Parent") as span:
        span.set_attributes({"level": "parent", "override": y == 4})
        span.set_inputs({"x": x, "y": y, "exp": exp})

        # Wrap an external function instead of modifying
        traced_pow = mlflow.trace(math.pow)

        # Call the wrapped function as you would call it directly
        raised = traced_pow(x, exp)

        # Wrap another external function
        traced_factorial = mlflow.trace(math.factorial)

        factorial = traced_factorial(int(raised))

        # Wrap another and call it directly
        response = mlflow.trace(math.sqrt)(factorial)

        # Set the outputs to the parent span prior to returning
        span.set_outputs({"result": response})

        return response


for i in range(8):
    invocation(i)
The screenshot below shows our external function wrapping runs within the MLflow UI.
Tracing Client APIs
Note
Client APIs are advanced features. We recommend using the client APIs only when you have specific requirements that are not met by the other APIs.
The MLflow client API provides a comprehensive set of thread-safe methods for manually managing traces. These APIs allow for fine-grained control over tracing, enabling you to create, manipulate, and retrieve traces programmatically. This section will cover how to use these APIs to manually trace a model, providing step-by-step instructions and examples.
Starting a Trace
Unlike with the fluent API, the MLflow Trace Client API requires that you explicitly start a trace before adding child spans. This initial API call starts the root span for the trace, providing a context request_id that is used for associating subsequent spans to the root span.
To start a new trace, use the mlflow.client.MlflowClient.start_trace() method. This method creates a new trace and returns the root span object.
from mlflow import MlflowClient

client = MlflowClient()

# Start a new trace
root_span = client.start_trace("my_trace")

# The request_id is used for creating additional spans that have a hierarchical association to this root span
request_id = root_span.request_id
Adding a Child Span
Once a trace is started, you can add child spans to it with the mlflow.client.MlflowClient.start_span() API. Child spans allow you to break down the trace into smaller, more manageable segments,
each representing a specific operation or step within the overall process.
# Create a child span
child_span = client.start_span(
    name="child_span",
    request_id=request_id,
    parent_id=root_span.span_id,
    inputs={"input_key": "input_value"},
    attributes={"attribute_key": "attribute_value"},
)
Ending a Span
After performing the operations associated with a span, you must end the span explicitly using the mlflow.client.MlflowClient.end_span() method. Make note of the two required fields
that are in the API signature:
request_id: The identifier associated with the root span
span_id: The identifier associated with the span that is being ended
In order to effectively end a particular span, both the root span (returned from calling start_trace) and the targeted span (returned from calling start_span)
need to be identified when calling the end_span API.
The initiating request_id can be accessed from any parent span object’s properties.
Note
Spans created via the Client API will need to be terminated manually. Ensure that all spans that have been started with the start_span API
have been ended with the end_span API.
# End the child span
client.end_span(
    request_id=child_span.request_id,
    span_id=child_span.span_id,
    outputs={"output_key": "output_value"},
    attributes={"custom_attribute": "value"},
)
Ending a Trace
To complete the trace, end the root span using the mlflow.client.MlflowClient.end_trace() method. This will also ensure that all associated child
spans are properly ended.
# End the root span (trace)
client.end_trace(
    request_id=request_id,
    outputs={"final_output_key": "final_output_value"},
    attributes={"token_usage": "1174"},
)
Searching and Retrieving Traces
You can search for traces based on various criteria using the mlflow.client.MlflowClient.search_traces() method or the fluent API mlflow.search_traces().
See Searching and Retrieving Traces for the usages of these APIs.
Deleting Traces
You can delete traces based on specific criteria using the mlflow.client.MlflowClient.delete_traces() method. This method allows you to delete traces by experiment ID,
maximum timestamp, or request IDs.
Tip
Deleting a trace is an irreversible process. Ensure that the setting provided within the delete_traces API meet the intended range for deletion.
import time

# Get the current timestamp in milliseconds
current_time = int(time.time() * 1000)

# Delete traces older than a specific timestamp
deleted_count = client.delete_traces(
    experiment_id="1", max_timestamp_millis=current_time, max_traces=10
)
Data Model and Schema
To explore the structure and schema of MLflow Tracing, please see the Tracing Schema guide.
Trace Tags
Tags can be added to traces to provide additional metadata at the trace level. For example, you can attach a session ID to a trace to group traces by a conversation session. MLflow provides APIs to set and delete tags on traces. Select the right API based on whether you want to set tags on an active trace or on an already finished trace.
API / Method |
Use Case |
|---|---|
Setting tags on an active trace during the code execution. |
|
Programmatically setting tags on a finished trace. |
|
MLflow UI |
Setting tags on a finished trace conveniently. |
Setting Tags on an Active Trace
If you are using automatic tracing or fluent APIs to create traces and want to add tags to the trace during its execution, you can use the mlflow.update_current_trace() function.
For example, the following code example adds the "fruit": "apple" tag to the trace created for the my_func function:
@mlflow.trace
def my_func(x):
    mlflow.update_current_trace(tags={"fruit": "apple"})
    return x + 1
Note
The :mlflow.update_current_trace() function adds the specified tag(s) to the current trace when the key is not already present. If the key is already present, it updates the key with the new value.
Setting Tags on a Finished Trace
To set tags on a trace that has already been completed and logged in the backend store, use the mlflow.client.MlflowClient.set_trace_tag() method to set a tag on a trace,
and the mlflow.client.MlflowClient.delete_trace_tag() method to remove a tag from a trace.
# Get the request ID fof the most recently created trace
trace = mlflow.get_last_active_trace()
request_id = trace.info.request_id

# Set a tag on a trace
client.set_trace_tag(request_id=request_id, key="tag_key", value="tag_value")

# Delete a tag from a trace
client.delete_trace_tag(request_id=request_id, key="tag_key")
Async Logging
By default, MLflow Traces are logged synchronously. This may introduce a performance overhead when logging Traces, especially when your MLflow Tracking Server is running on a remote server. If the performance overhead is a concern for you, you can enable asynchronous logging for tracing in MLflow 2.16.0 and later.
To enable async logging for tracing, call mlflow.config.enable_async_logging() in your code. This will make the trace logging operation non-blocking and reduce the performance overhead.
import mlflow

mlflow.config.enable_async_logging()

# Traces will be logged asynchronously
with mlflow.start_span(name="foo") as span:
    span.set_inputs({"a": 1})
    span.set_outputs({"b": 2})

# If you don't see the traces in the UI after waiting for a while, you can manually flush the traces
# mlflow.flush_trace_async_logging()
Note that the async logging does not fully eliminate the performance overhead. Some backend calls still need to be made synchronously and there are other factors such as data serialization. However, async logging can significantly reduce the overall overhead of logging traces, empirically about ~80% for typical workloads.
Using OpenTelemetry Collector for Exporting Traces
Traces generated by MLflow are compatible with the OpenTelemetry trace specs. Therefore, MLflow Tracing supports exporting traces to an OpenTelemetry Collector, which can then be used to export traces to various backends such as Jaeger, Zipkin, and AWS X-Ray.
By default, MLflow exports traces to the MLflow Tracking Server. To enable exporting traces to an OpenTelemetry Collector, set the OTEL_EXPORTER_OTLP_ENDPOINT environment variable (or OTEL_EXPORTER_OTLP_TRACES_ENDPOINT) to the target URL of the OpenTelemetry Collector before starting any trace.
import mlflow
import os

# Set the endpoint of the OpenTelemetry Collector
os.environ["OTEL_EXPORTER_OTLP_TRACES_ENDPOINT"] = "http://localhost:4317/v1/traces"
# Optionally, set the service name to group traces
os.environ["OTEL_SERVICE_NAME"] = "<your-service-name>"

# Trace will be exported to the OTel collector at http://localhost:4317/v1/traces
with mlflow.start_span(name="foo") as span:
    span.set_inputs({"a": 1})
    span.set_outputs({"b": 2})
Warning
MLflow only exports traces to a single destination. When the OTEL_EXPORTER_OTLP_ENDPOINT environment variable is configured, MLflow will not export traces to the MLflow Tracking Server and you will not see traces in the MLflow UI.
Similarly, if you deploy the model to the Databricks Model Serving with tracing enabled, using the OpenTelemetry Collector will result in traces not being recorded in the Inference Table.
Configurations
MLflow uses the standard OTLP Exporter for exporting traces to OpenTelemetry Collector instances. Thereby, you can use all of the configurations supported by OpenTelemetry. The following example configures the OTLP Exporter to use HTTP protocol instead of the default gRPC and sets custom headers:
export OTEL_EXPORTER_OTLP_TRACES_ENDPOINT="http://localhost:4317/v1/traces"
export OTEL_EXPORTER_OTLP_TRACES_PROTOCOL="http/protobuf"
export OTEL_EXPORTER_OTLP_TRACES_HEADERS="api_key=12345"
FAQ
Q: Can I disable and re-enable tracing globally?
Yes.
There are two fluent APIs that are used for blanket enablement or disablement of the MLflow Tracing feature in order to support users who may not wish to record interactions with their trace-enabled models for a brief period, or if they have concerns about long-term storage of data that was sent along with a request payload to a model in interactive mode.
To disable tracing, the mlflow.tracing.disable() API will cease the collection of trace data from within MLflow and will not log
any data to the MLflow Tracking service regarding traces.
To enable tracing (if it had been temporarily disabled), the mlflow.tracing.enable() API will re-enable tracing functionality for instrumented models
that are invoked.
Q: How can I associate a trace with an MLflow Run?
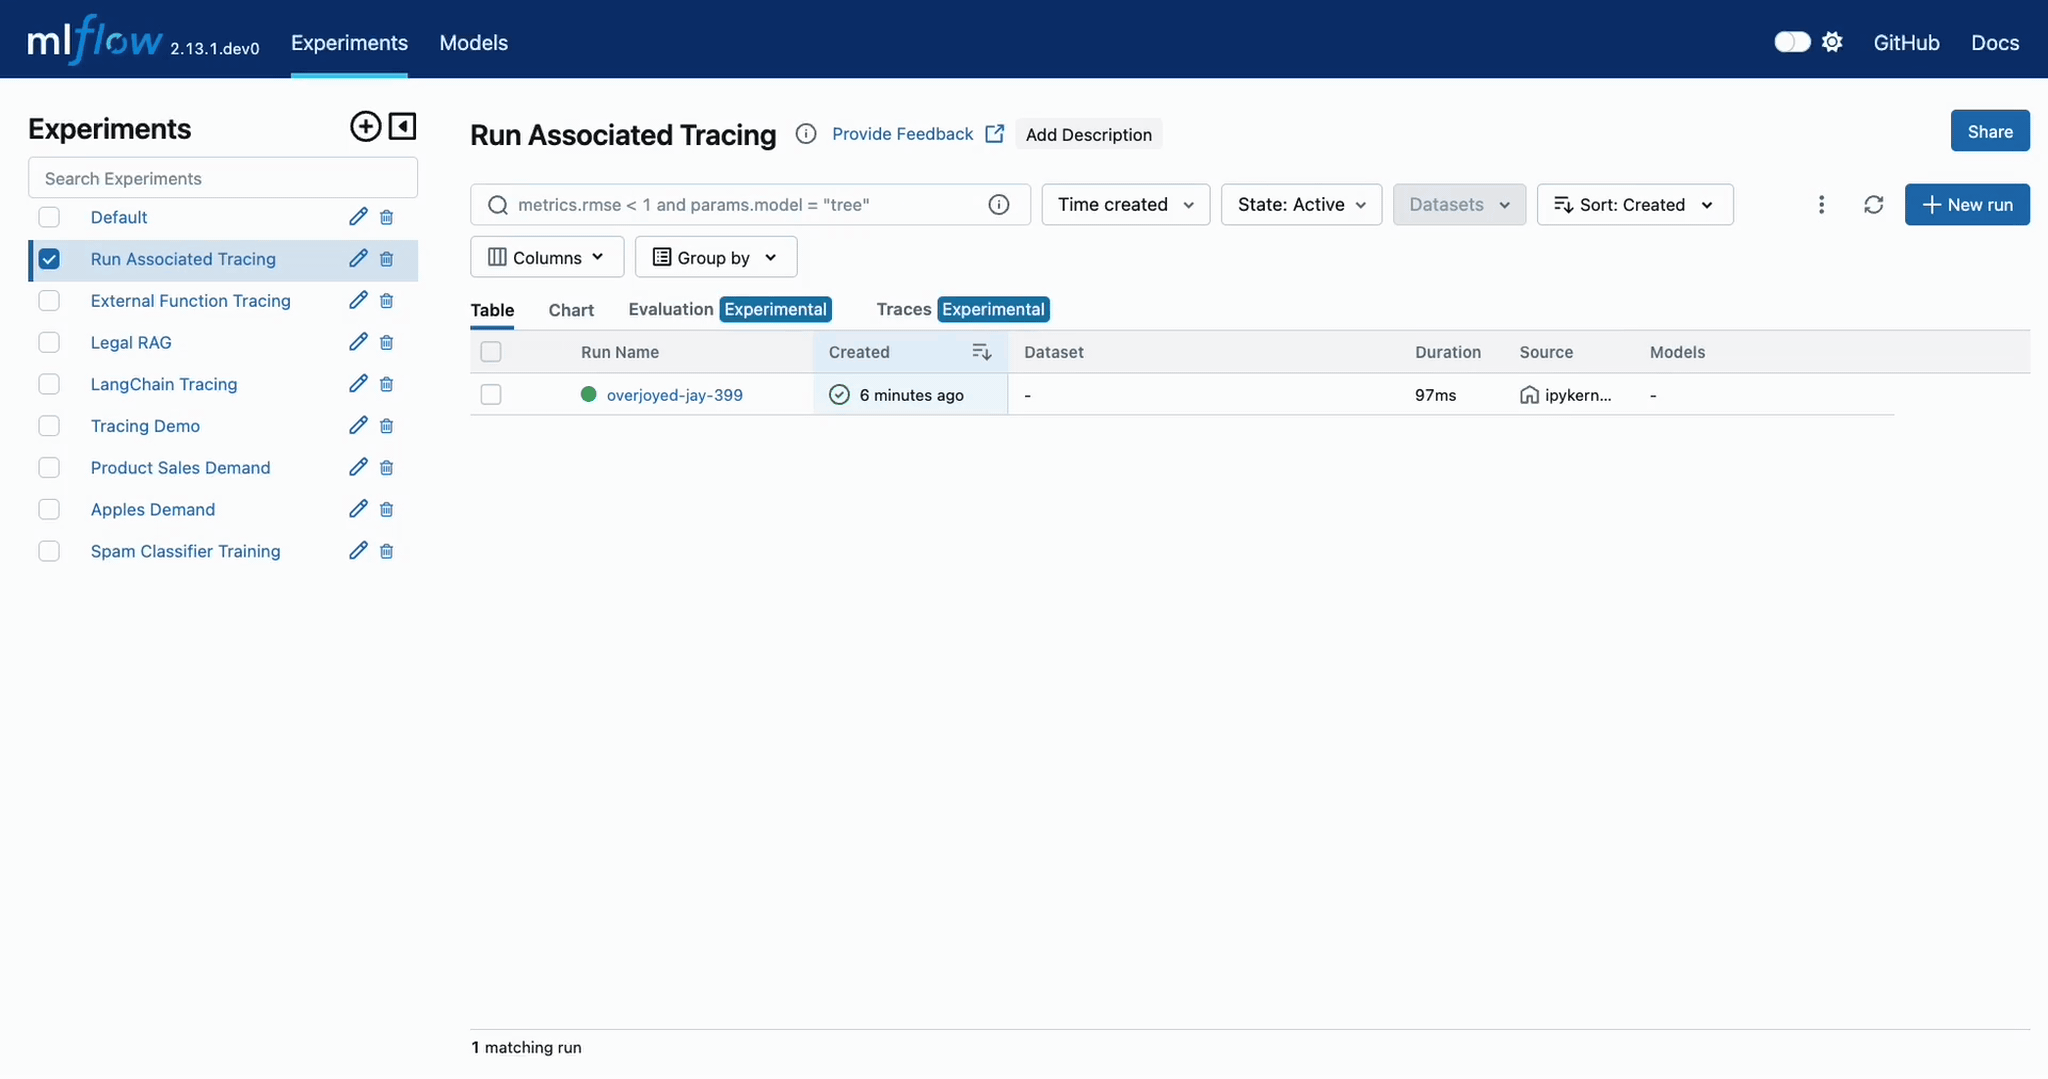
If a trace is generated within a run context, the recorded traces to an active Experiment will be associated with the active Run.
For example, in the following code, the traces are generated within the start_run context.
import mlflow

# Create and activate an Experiment
mlflow.set_experiment("Run Associated Tracing")

# Start a new MLflow Run
with mlflow.start_run() as run:
    # Initiate a trace by starting a Span context from within the Run context
    with mlflow.start_span(name="Run Span") as parent_span:
        parent_span.set_inputs({"input": "a"})
        parent_span.set_outputs({"response": "b"})
        parent_span.set_attribute("a", "b")
        # Initiate a child span from within the parent Span's context
        with mlflow.start_span(name="Child Span") as child_span:
            child_span.set_inputs({"input": "b"})
            child_span.set_outputs({"response": "c"})
            child_span.set_attributes({"b": "c", "c": "d"})
When navigating to the MLflow UI and selecting the active Experiment, the trace display view will show the run that is associated with the trace, as well as providing a link to navigate to the run within the MLflow UI. See the below video for an example of this in action.
You can also programmatically retrieve the traces associated to a particular Run by using the mlflow.client.MlflowClient.search_traces() method.
from mlflow import MlflowClient

client = MlflowClient()

# Retrieve traces associated with a specific Run
traces = client.search_traces(run_id=run.info.run_id)

print(traces)
Q: Can I use the fluent API and the client API together?
You definitely can. However, the Client API is much more verbose than the fluent API and is designed for more complex use cases where you need to control asynchronous tasks for which a context manager will not have the ability to handle an appropriate closure over the context.
Mixing the two, while entirely possible, is not generally recommended.
For example, the following will work:
import mlflow

# Initiate a fluent span creation context
with mlflow.start_span(name="Testing!") as span:
    # Use the client API to start a child span
    child_span = client.start_span(
        name="Child Span From Client",
        request_id=span.request_id,
        parent_id=span.span_id,
        inputs={"request": "test input"},
        attributes={"attribute1": "value1"},
    )

    # End the child span
    client.end_span(
        request_id=span.request_id,
        span_id=child_span.span_id,
        outputs={"response": "test output"},
        attributes={"attribute2": "value2"},
    )
Warning
Using the fluent API to manage a child span of a client-initiated root span or child span is not possible.
Attempting to start a start_span context handler while using the client API will result in two traces being created,
one for the fluent API and one for the client API.
Q: How can I add custom metadata to a span?
There are several ways.
Fluent API
Within the
mlflow.start_span()constructor itself.
with mlflow.start_span(
    name="Parent", attributes={"attribute1": "value1", "attribute2": "value2"}
) as span:
    span.set_inputs({"input1": "value1", "input2": "value2"})
    span.set_outputs({"output1": "value1", "output2": "value2"})
Using the
set_attributeorset_attributesmethods on thespanobject returned from thestart_spanreturned object.
with mlflow.start_span(name="Parent") as span:
    # Set multiple attributes
    span.set_attributes({"attribute1": "value1", "attribute2": "value2"})
    # Set a single attribute
    span.set_attribute("attribute3", "value3")
Client API
When starting a span, you can pass in the attributes as part of the
start_traceandstart_spanmethod calls.
parent_span = client.start_trace(
    name="Parent Span",
    attributes={"attribute1": "value1", "attribute2": "value2"}
)

child_span = client.start_span(
    name="Child Span",
    request_id=parent_span.request_id,
    parent_id=parent_span.span_id,
    attributes={"attribute1": "value1", "attribute2": "value2"}
)
Utilize the
set_attributeorset_attributesAPIs directly on theSpanobjects.
parent_span = client.start_trace(
    name="Parent Span", attributes={"attribute1": "value1", "attribute2": "value2"}
)

# Set a single attribute
parent_span.set_attribute("attribute3", "value3")
# Set multiple attributes
parent_span.set_attributes({"attribute4": "value4", "attribute5": "value5"})
Set attributes when ending a span or the entire trace.
client.end_span(
    request_id=parent_span.request_id,
    span_id=child_span.span_id,
    attributes={"attribute1": "value1", "attribute2": "value2"},
)

client.end_trace(
    request_id=parent_span.request_id,
    attributes={"attribute3": "value3", "attribute4": "value4"},
)
Q: I cannot open my trace in the MLflow UI. What should I do?
There are multiple possible reasons why a trace may not be viewable in the MLflow UI.
The trace is not completed yet: If the trace is still being collected, MLflow cannot display spans in the UI. Ensure that all spans are properly ended with either “OK” or “ERROR” status.
The browser cache is outdated: When you upgrade MLflow to a new version, the browser cache may contain outdated data and prevent the UI from displaying traces correctly. Clear your browser cache (Shift+F5) and refresh the page.
Q. How to group multiple traces within a single conversation session?
In conversational AI applications, it is common that users interact with the model multiple times within a single conversation session. Since each interaction generates a trace in the typical MLflow setup, it is useful to group these traces together to analyze the conversation as a whole. You can achieve this by attaching the session ID as a tag to each trace.
The following example shows how to use session ID in a chat model that has been implemented using the mlflow.pyfunc.ChatModel class. Refer to the Trace Tags section for more information on how to set tags on traces.
import mlflow
from mlflow.entities import SpanType
from mlflow.types.llm import ChatMessage, ChatParams, ChatCompletionResponse

import openai
from typing import Optional

mlflow.set_experiment("Tracing Session ID Demo")


class ChatModelWithSession(mlflow.pyfunc.ChatModel):
    @mlflow.trace(span_type=SpanType.CHAT_MODEL)
    def predict(
        self, context, messages: list[ChatMessage], params: Optional[ChatParams] = None
    ) -> ChatCompletionResponse:
        if session_id := (params.custom_inputs or {}).get("session_id"):
            # Set session ID tag on the current trace
            mlflow.update_current_trace(tags={"session_id": session_id})

        response = openai.OpenAI().chat.completions.create(
            messages=[m.to_dict() for m in messages],
            model="gpt-4o-mini",
        )

        return ChatCompletionResponse.from_dict(response.to_dict())


model = ChatModelWithSession()

# Invoke the chat model multiple times with the same session ID
session_id = "123"
messages = [ChatMessage(role="user", content="What is MLflow Tracing?")]
response = model.predict(
    None, messages, ChatParams(custom_inputs={"session_id": session_id})
)

# Invoke again with the same session ID
messages.append(
    ChatMessage(role="assistant", content=response.choices[0].message.content)
)
messages.append(ChatMessage(role="user", content="How to get started?"))
response = model.predict(
    None, messages, ChatParams(custom_inputs={"session_id": session_id})
)
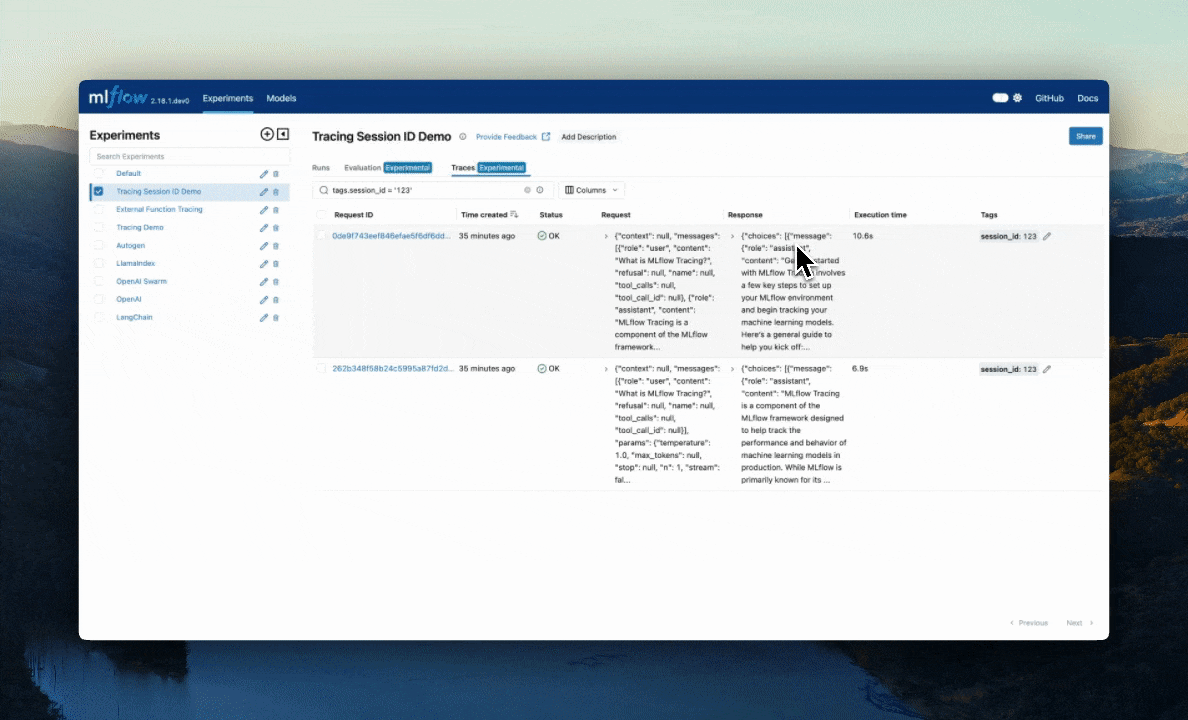
The above code creates two new traces with the same session ID tag. Within the MLflow UI, you can search for these traces that have this defined session ID using tag.session_id = '123'.
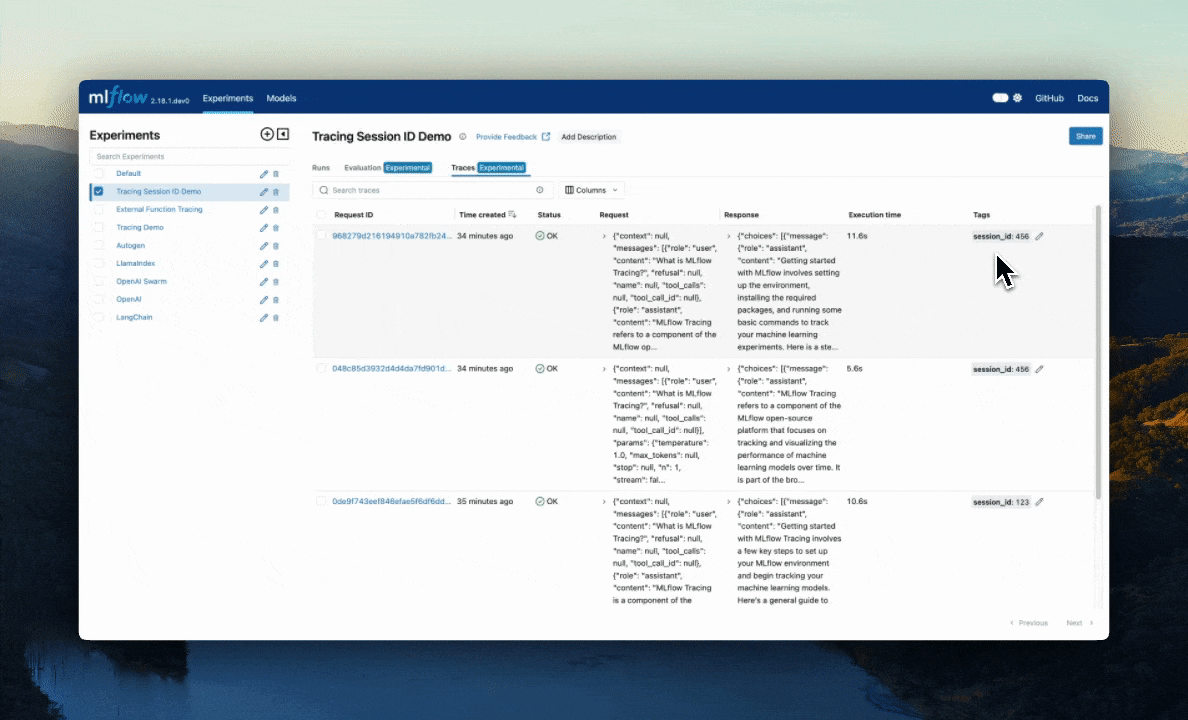
Alternatively, you can use the mlflow.search_traces() function to get these traces programmatically.
traces = mlflow.search_traces(filter_string="tag.session_id = '123456'")
Q: How to find a particular span within a trace?
When you have a large number of spans in a trace, it can be cumbersome to find a particular span. You can use the Trace.search_spans method to search for spans based on several criteria.
import mlflow
from mlflow.entities import SpanType


@mlflow.trace(span_type=SpanType.CHAIN)
def run(x: int) -> int:
    x = add_one(x)
    x = add_two(x)
    x = multiply_by_two(x)
    return x


@mlflow.trace(span_type=SpanType.TOOL)
def add_one(x: int) -> int:
    return x + 1


@mlflow.trace(span_type=SpanType.TOOL)
def add_two(x: int) -> int:
    return x + 2


@mlflow.trace(span_type=SpanType.TOOL)
def multiply_by_two(x: int) -> int:
    return x * 2


# Run the function and get the trace
y = run(2)
trace = mlflow.get_last_active_trace()
This will create a Trace object with four spans.
run (CHAIN)
  ├── add_one (TOOL)
  ├── add_two (TOOL)
  └── multiply_by_two (TOOL)
Then you can use the Trace.search_spans method to search for a particular spans:
# 1. Search by span name (exact match)
spans = trace.search_spans(name="add_one")
print(spans)
# Output: [Span(name='add_one', ...)]

# Search for a span with the span type "TOOL"
spans = trace.search_spans(span_type=SpanType.TOOL)
print(spans)
# Output: [Span(name='add_one', ...), Span(name='add_two', ...), Span(name='multiply_by_two', ...)]

# Search for spans whose name starts with "add"
spans = trace.search_spans(name=re.compile(r"add.*"))
print(spans)
# Output: [Span(name='add_one', ...), Span(name='add_two', ...)]