5 Minute Tracking Server Overview
In this guide we will walk you through how to view your MLflow experiment results with different types of tracking server configurations. At a high level, there are 3 ways to view your MLflow experiments:
[Method 1] Start your own MLflow server.
[Method 2] Use a free hosted tracking server - Databricks Community Edition.
[Method 3] Use production Databricks/AzureML.
To choose among these 3 methods, here is our recommendation:
If you have privacy concerns (data/model/tech stack), use Method 1 - start your own server.
If you are a student or an individual researcher, or if you are developing in cloud-based notebooks (e.g., Google Colab), use Method 2 - free hosted tracking server.
Enterprise users, or if you want to serve or deploy your model for a production use-case, please use Method 3 - production Databricks/AzureML.
Overall Method 2 - free hosted tracking server is the simplest way to get started with MLflow, but please pick the method that best suits your needs.
Method 1: Start Your Own MLflow Server
Disclaimier: This part of guide is not suitable for running in a cloud-provided IPython environment (e.g., Collab, Databricks). Please follow the guide below in your local machine (laptop/desktop).
A hosted tracking server is the simplest way to store and view MLflow experiments, but it is not suitable for every user. For example, you may not want to expose your data and model to others in your cloud provider account. In this case, you can use a local hosted MLflow server to store and view your experiments. To do so, there are two steps:
Start your MLflow server.
Connect MLflow session to the local MLflow server IP by
mlflow.set_tracking_uri().
Start a Local MLflow Server
If you don’t have MLflow installed, please run the command below to install it:
$ pip install mlflow
The installation of MLflow includes the MLflow CLI tool, so you can start a local MLflow server with UI by running the command below in your terminal:
$ mlflow ui
It will generate logs with the IP address, for example:
(mlflow) [master][~/Documents/mlflow_team/mlflow]$ mlflow ui
[2023-10-25 19:39:12 -0700] [50239] [INFO] Starting gunicorn 20.1.0
[2023-10-25 19:39:12 -0700] [50239] [INFO] Listening at: http://127.0.0.1:5000 (50239)
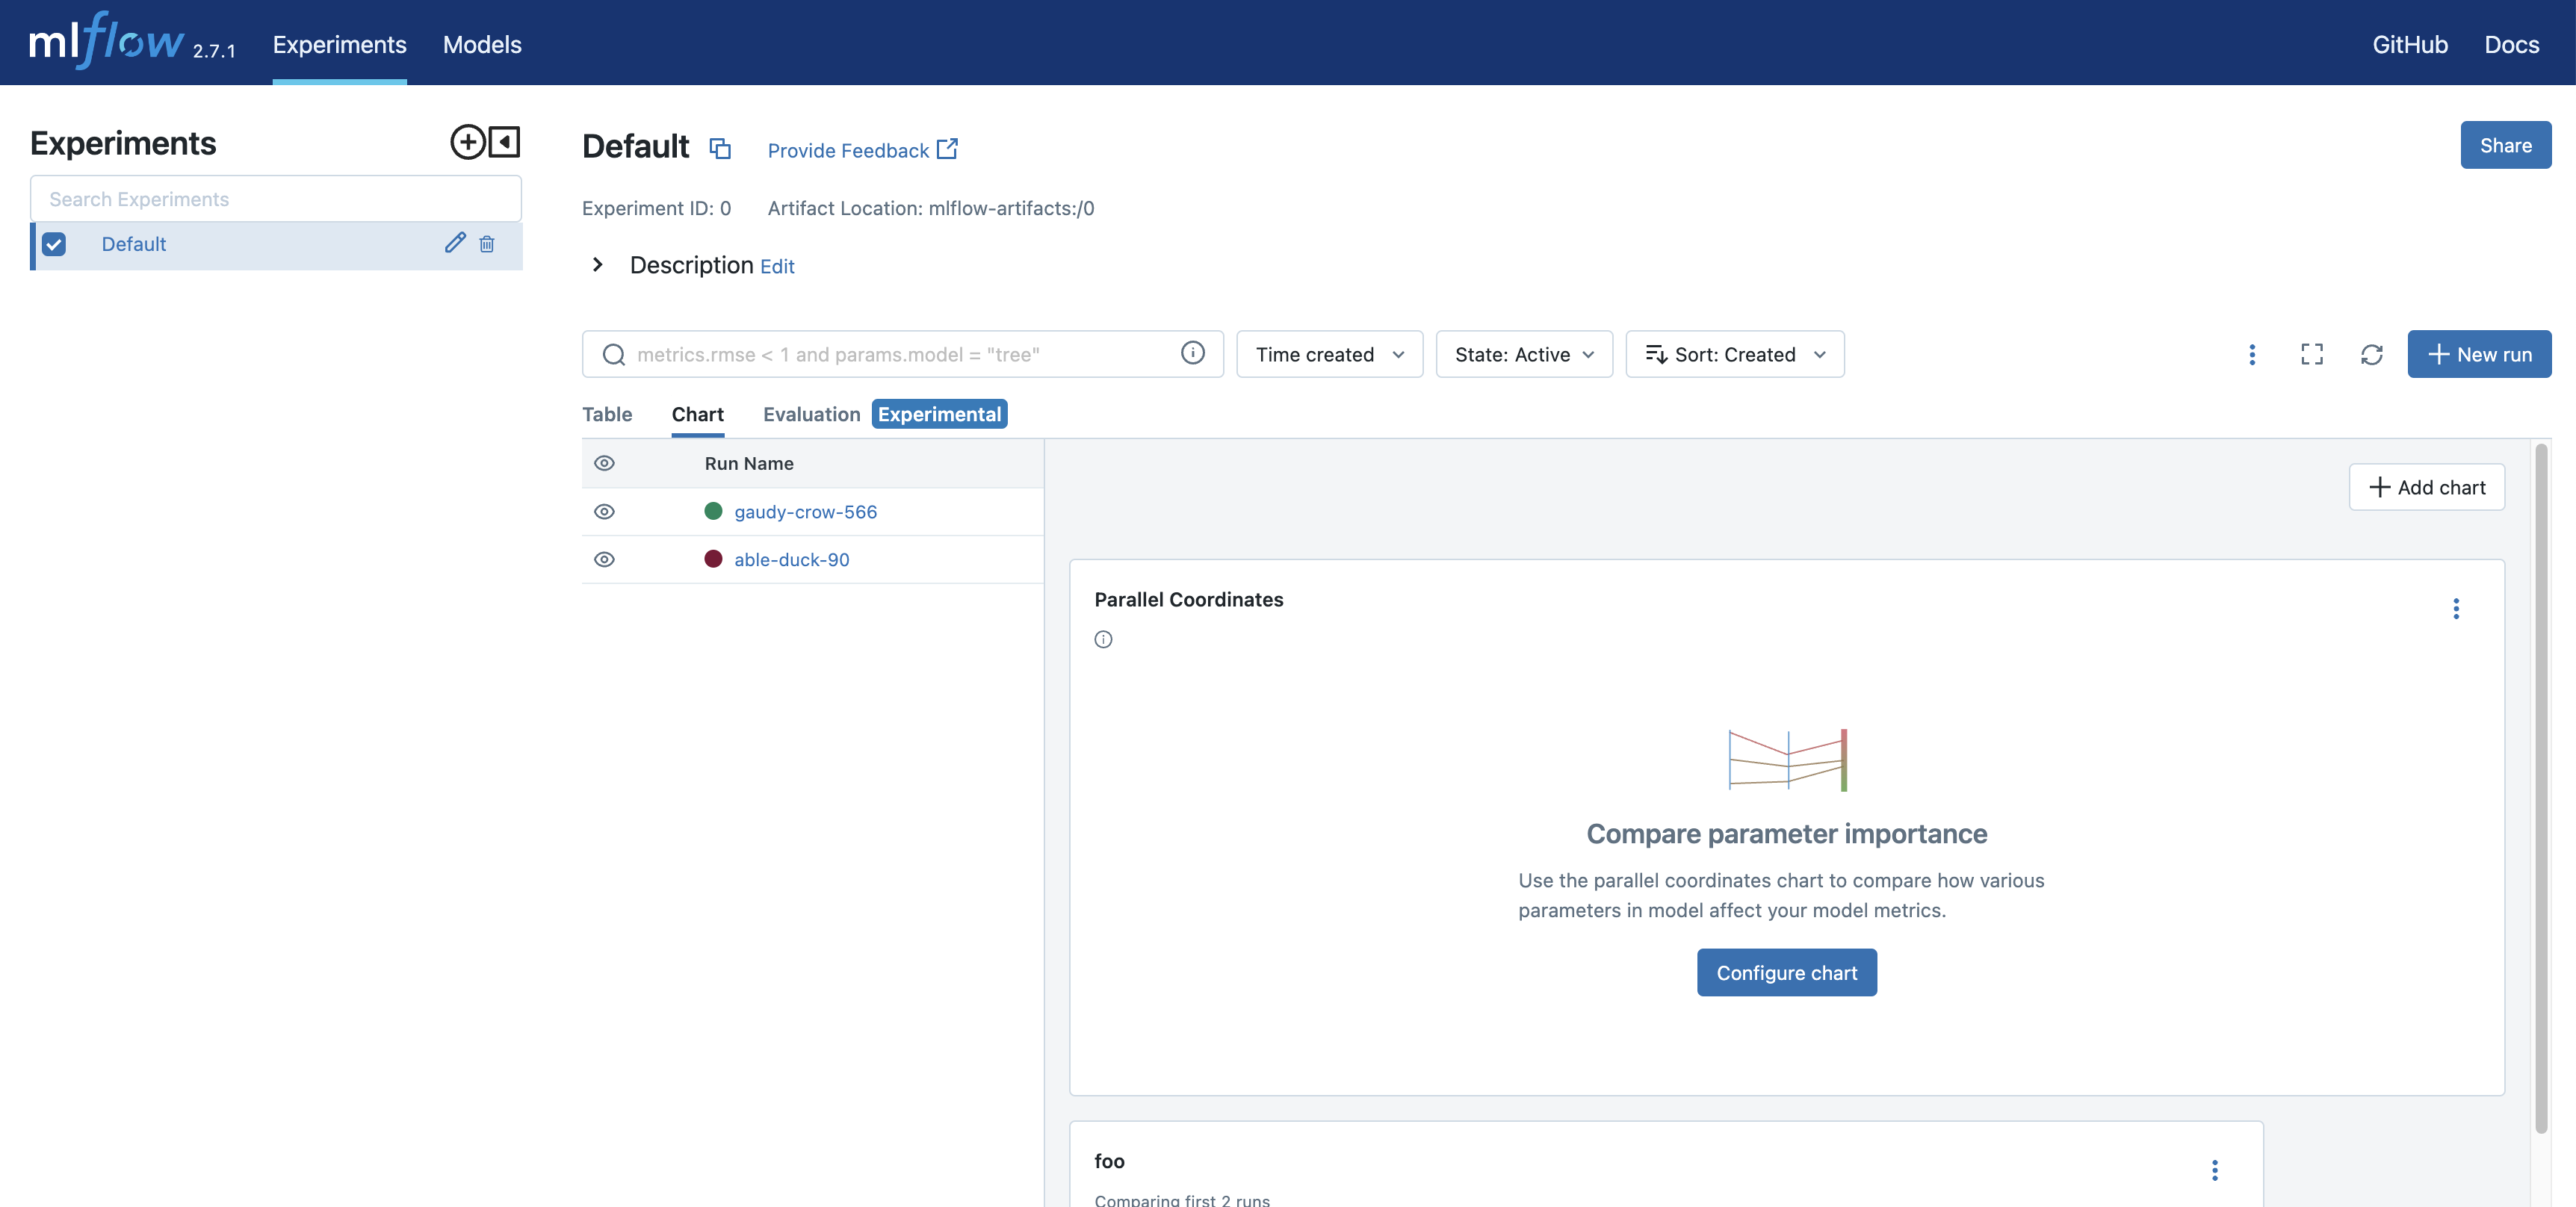
Opening the URL of the MLflow tracking server in your browser will bring you to the MLflow UI. The image below is from the open source version of the MLflow UI, which is a bit different from the MLflow UI on Databricks CE. Below is a screenshot of the landing page:
Note
It’s also possible to deploy your own MLflow server on cloud platforms, but it is out of the scope of this guide.
Connect MLflow Session to Your Server
Now that the server is spun up, let’s connect our MLflow session to the local server. This is very similar to how we connect to a remote hosted tracking provider such as the Databricks platform.
mlflow.set_tracking_uri("http://localhost:5000")
Next, let’s try logging some dummy metrics. We can view these test metrics on the local hosted UI:
mlflow.set_experiment("check-localhost-connection")

with mlflow.start_run():
    mlflow.log_metric("foo", 1)
    mlflow.log_metric("bar", 2)
Putting it together you can copy the following code to your editor and save it as log_mlflow_with_localhost.py:
import mlflow

mlflow.set_tracking_uri("http://localhost:5000")
mlflow.set_experiment("check-localhost-connection")

with mlflow.start_run():
    mlflow.log_metric("foo", 1)
    mlflow.log_metric("bar", 2)
Then execute it by:
$ python log_mlflow_with_localhost.py
View Experiment on Your MLflow Server
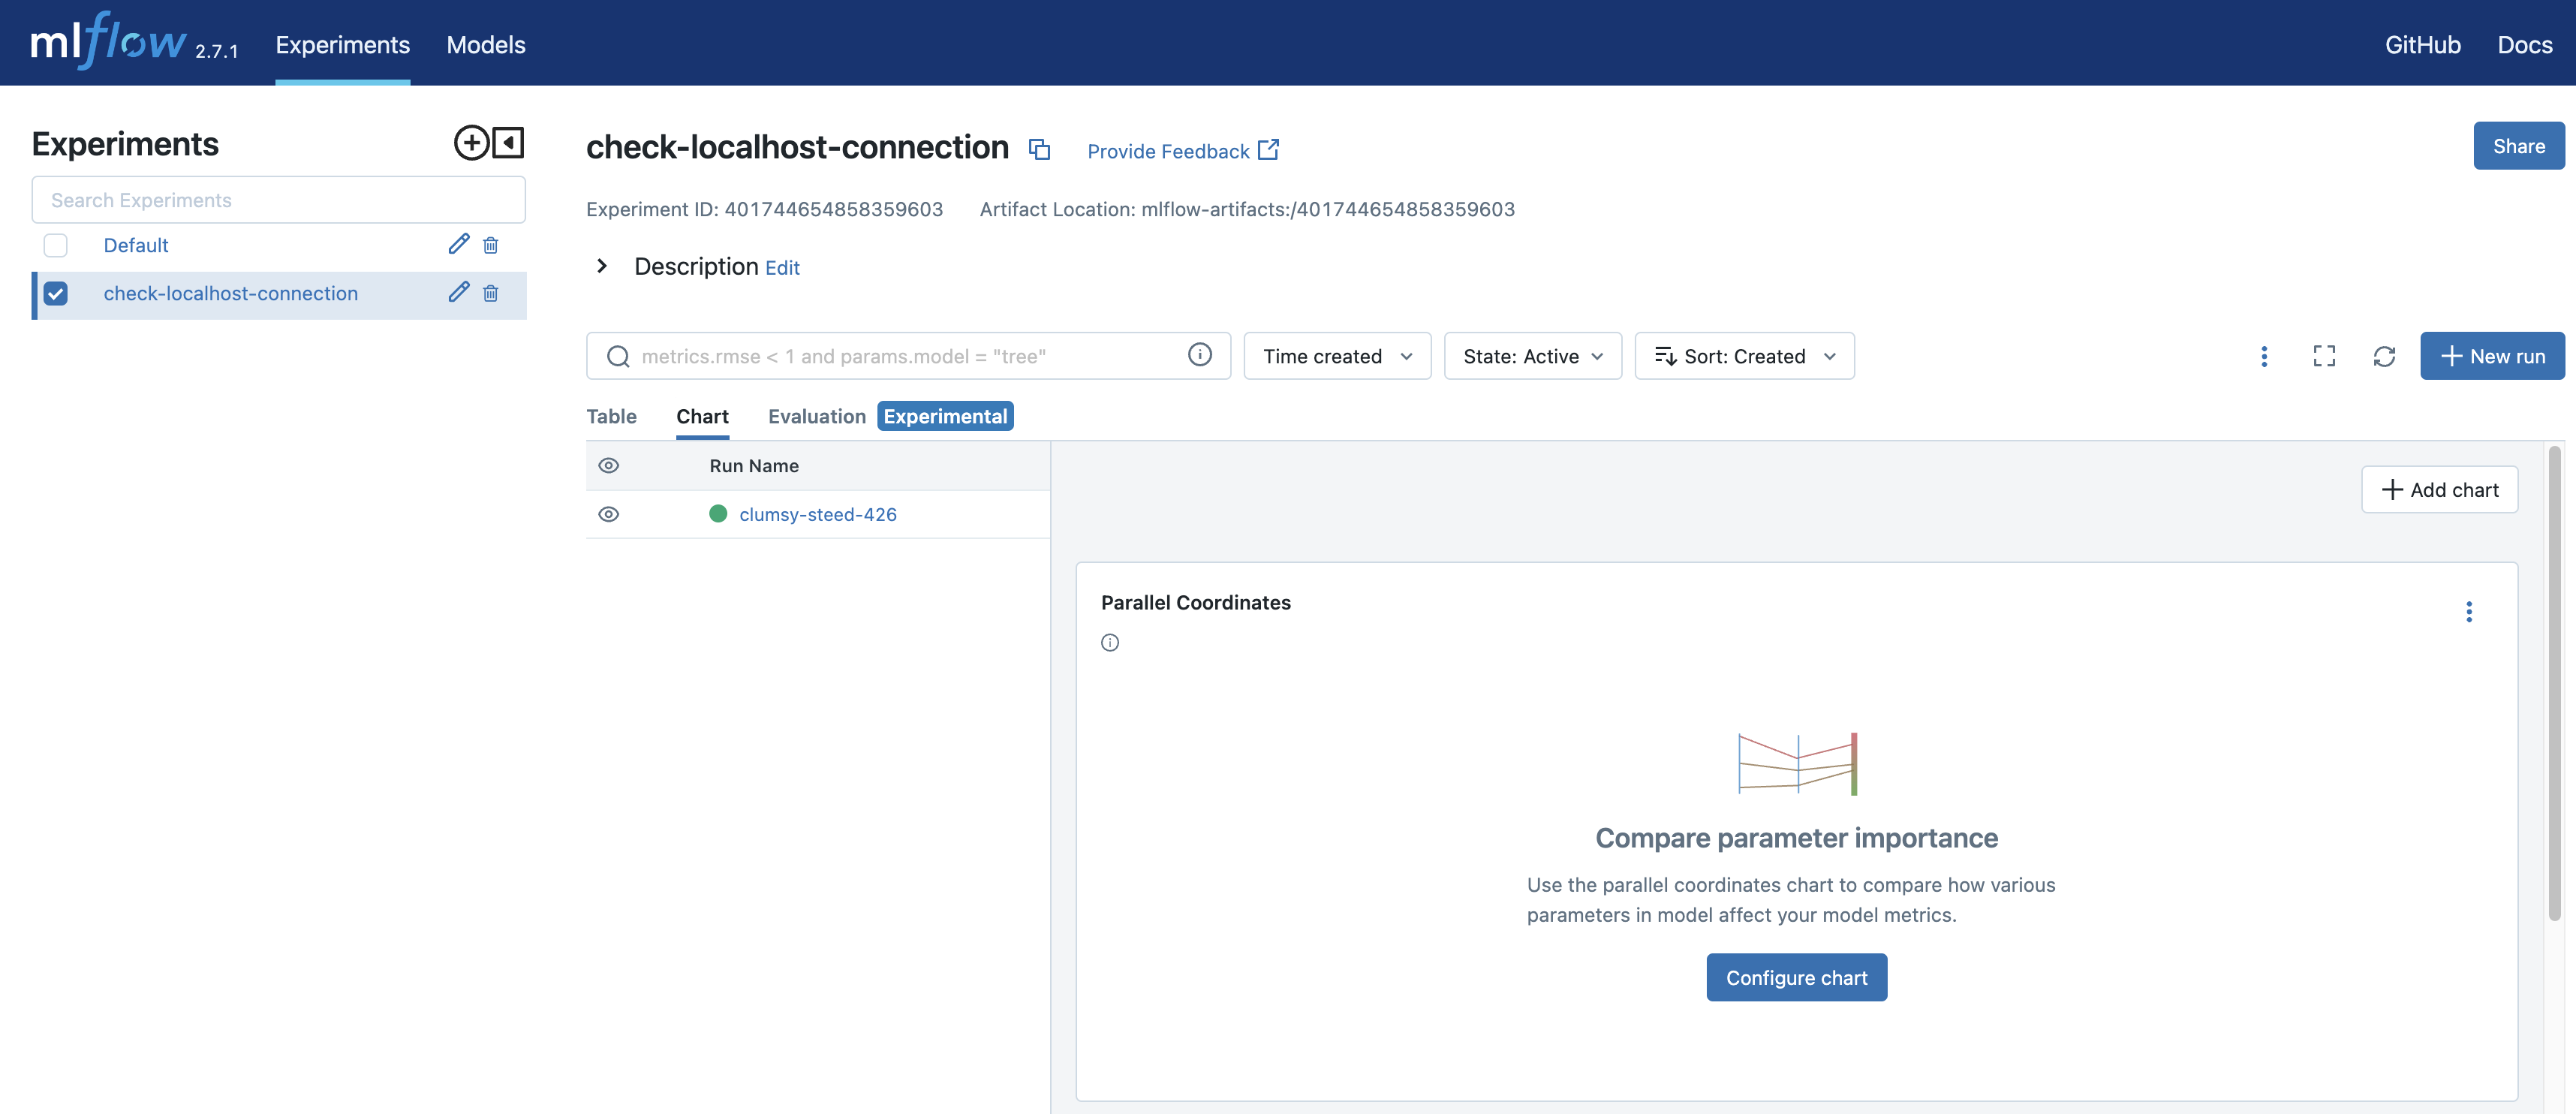
Now let’s view your experiment on the local server. Open the URL in your browser, which is http://localhost:5000 in our case. In the UI, inside the left sidebar you should see the experiment with name “check-localhost-connection”. Clicking on this experiment name should bring you to the experiment view, similar to what is shown below.
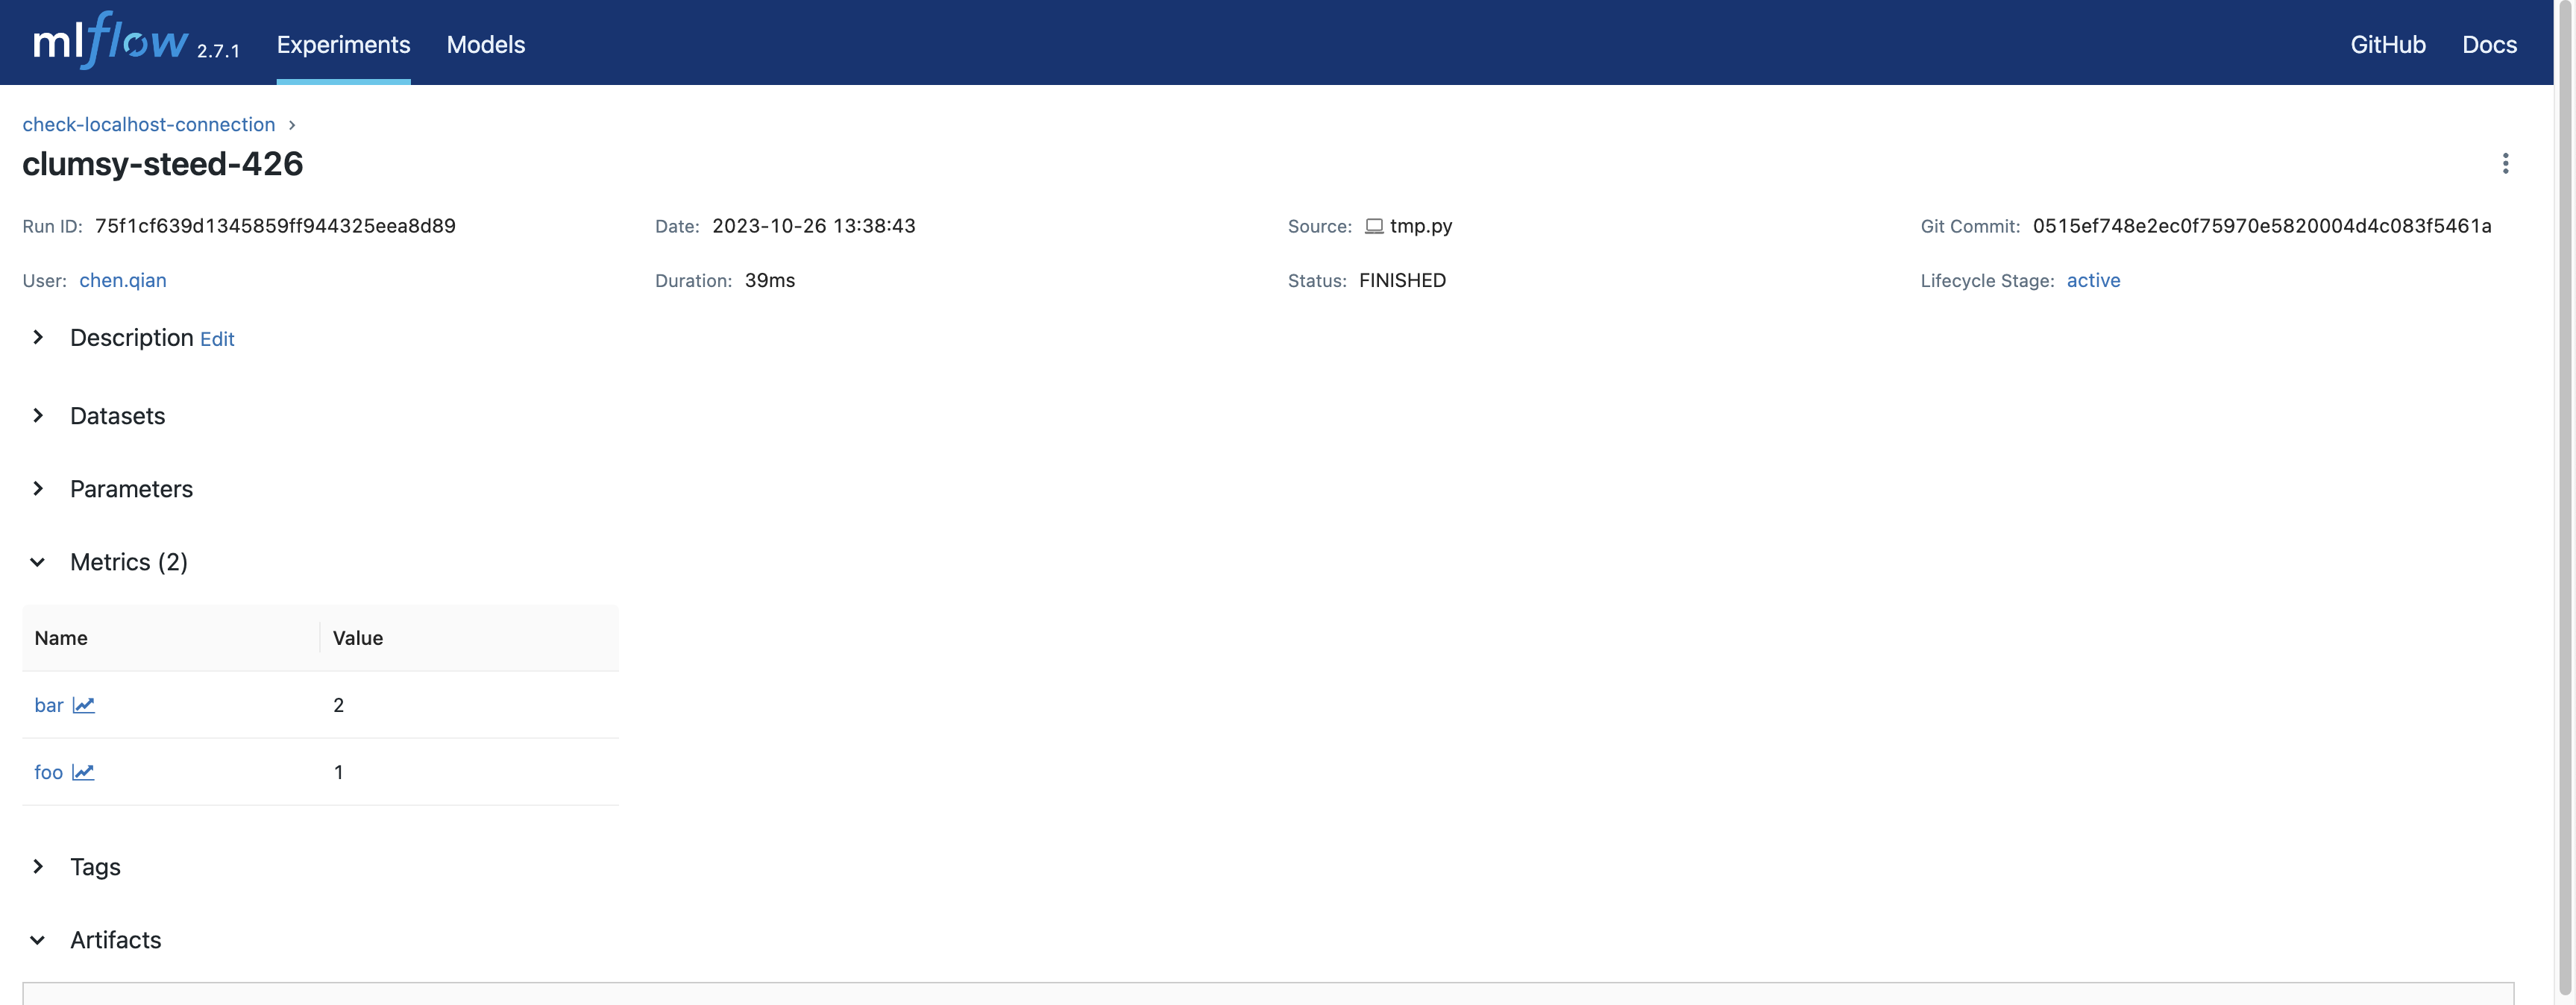
Clicking on the run (“clumsy-steed-426” in this example, yours will be different) will bring you to the run view, similar as below.
Conclusion
That’s all about how to start your own MLflow server and view your experiments. Please see the pros and cons of this method below:
Pros
You have full control of your data and model, which is good for privacy concerns.
No subscription is required.
Unlimited quota of experiments/runs.
You can even customize your UI by forking the MLflow repo and modify the UI code.
Cons
Requires manual setup and maintenance.
Team collaboration is harder than using a hosted tracking server.
Not suitable for cloud-based notebook, e.g., Google Colab.
Requires extra port forwarding if you deploy your server on cloud VM.
No serving support.
Method 2: Use Free Hosted Tracking Server (Databricks Community Edition)
Notice: This part of guide can be directly executed in cloud-based notebook, e.g., Google Colab or Databricks Notebook.
Databricks Community Edition (CE) is the free, limited-use version of the cloud-based big data platform Databricks. Databricks CE users can access a micro-cluster as well as a cluster manager and notebook environment. All users can share their notebooks and host them free of charge with Databricks. You can use Databricks CE to store and view your MLflow experiments without being charged.
To use Databricks CE to store and view our MLflow experiments, basically we need to:
Create a free Databricks CE account.
Set up Databricks CE authentication in our dev environment.
Connect to Databricks CE in our MLflow experiment session.
Then the experiment results will be automatically sent to Databricks CE, where you can view it in MLflow experiment UI. Now let’s look at the code.
Create a Databricks CE Account
If you don’t have an account of Databricks CE yet, you can create one here. The full process should take no longer than 3 minutes.
Set Up Authentication of Databricks CE
To set up Databricks CE authentication, we can use the API mlflow.login(), which will prompt you for required information:
Databricks Host: Use https://community.cloud.databricks.com/
Username: Your email address that signs in Databricks CE.
Password: Your password of Databricks CE.
If the authentication succeeds, you should see a message “Succesfully signed in Databricks!”.
import mlflow

mlflow.login()
2023/10/25 22:59:27 ERROR mlflow.utils.credentials: Failed to sign in Databricks: default auth: cannot configure default credentials
Databricks Host (should begin with https://): https://community.cloud.databricks.com/
Username: weirdmouse@gmail.com
Password: ··········
2023/10/25 22:59:38 INFO mlflow.utils.credentials: Succesfully signed in Databricks!
Connect MLflow Session to Databricks CE
We have set up the credentials, now we need to tell MLflow to send the data into Databricks CE.
To do so, we will use mlflow.set_tracking_uri("databricks") to port MLflow to Databricks CE. Basically
it is the command below. Please note that you need to always use “databricks” as the keyword.
mlflow.set_tracking_uri("databricks")
Now you are ready to go! Let’s try starting an MLflow experiment and log some dummy metrics and view it in our UI.
mlflow.set_experiment("/check-databricks-connection")

with mlflow.start_run():
    mlflow.log_metric("foo", 1)
    mlflow.log_metric("bar", 2)
2023/10/25 23:15:42 INFO mlflow.tracking.fluent: Experiment with name '/check-databricks-ce-connection' does not exist. Creating a new experiment.
View Your Experiment on Databricks CE
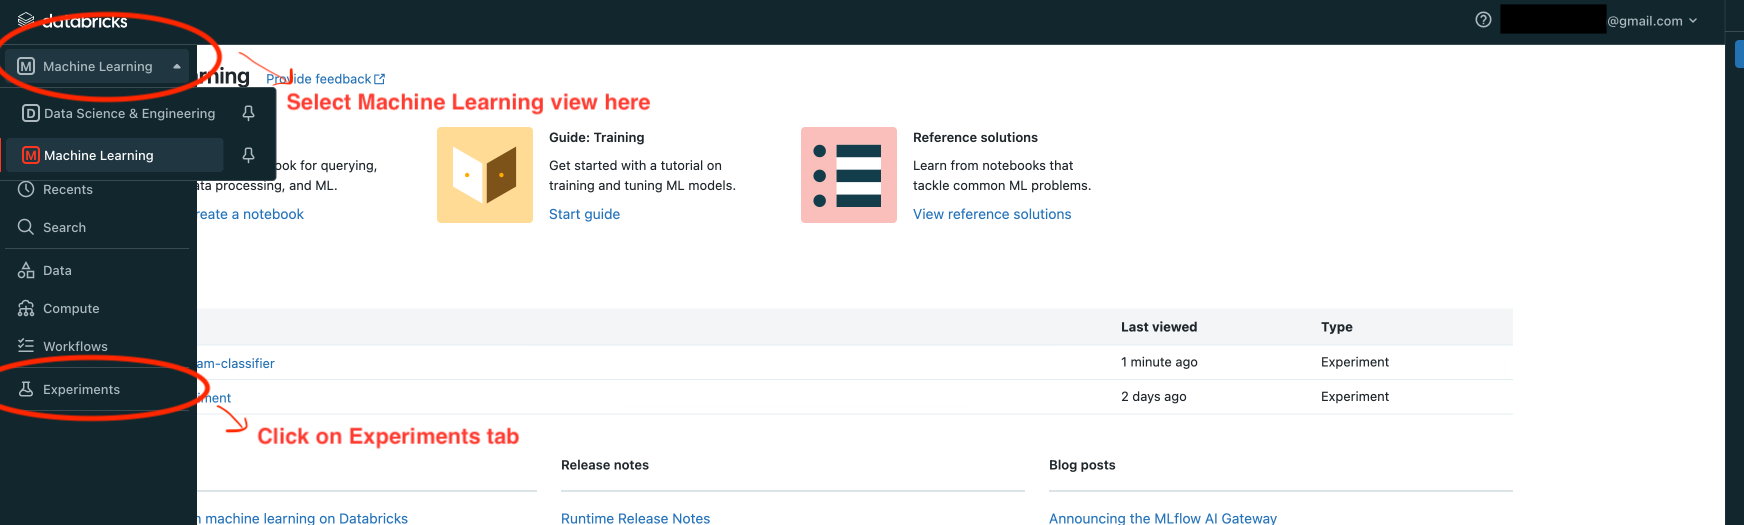
Now let’s navigate to Databricks CE to view the experiment result. Log in to your Databricks CE account, and click on top left to select machine learning in the drop down list. Then click on the experiment icon. See the screenshot below:
In the “Experiments” view, you should be able to find the experiment “/check-databricks-ce-connection”, similar to
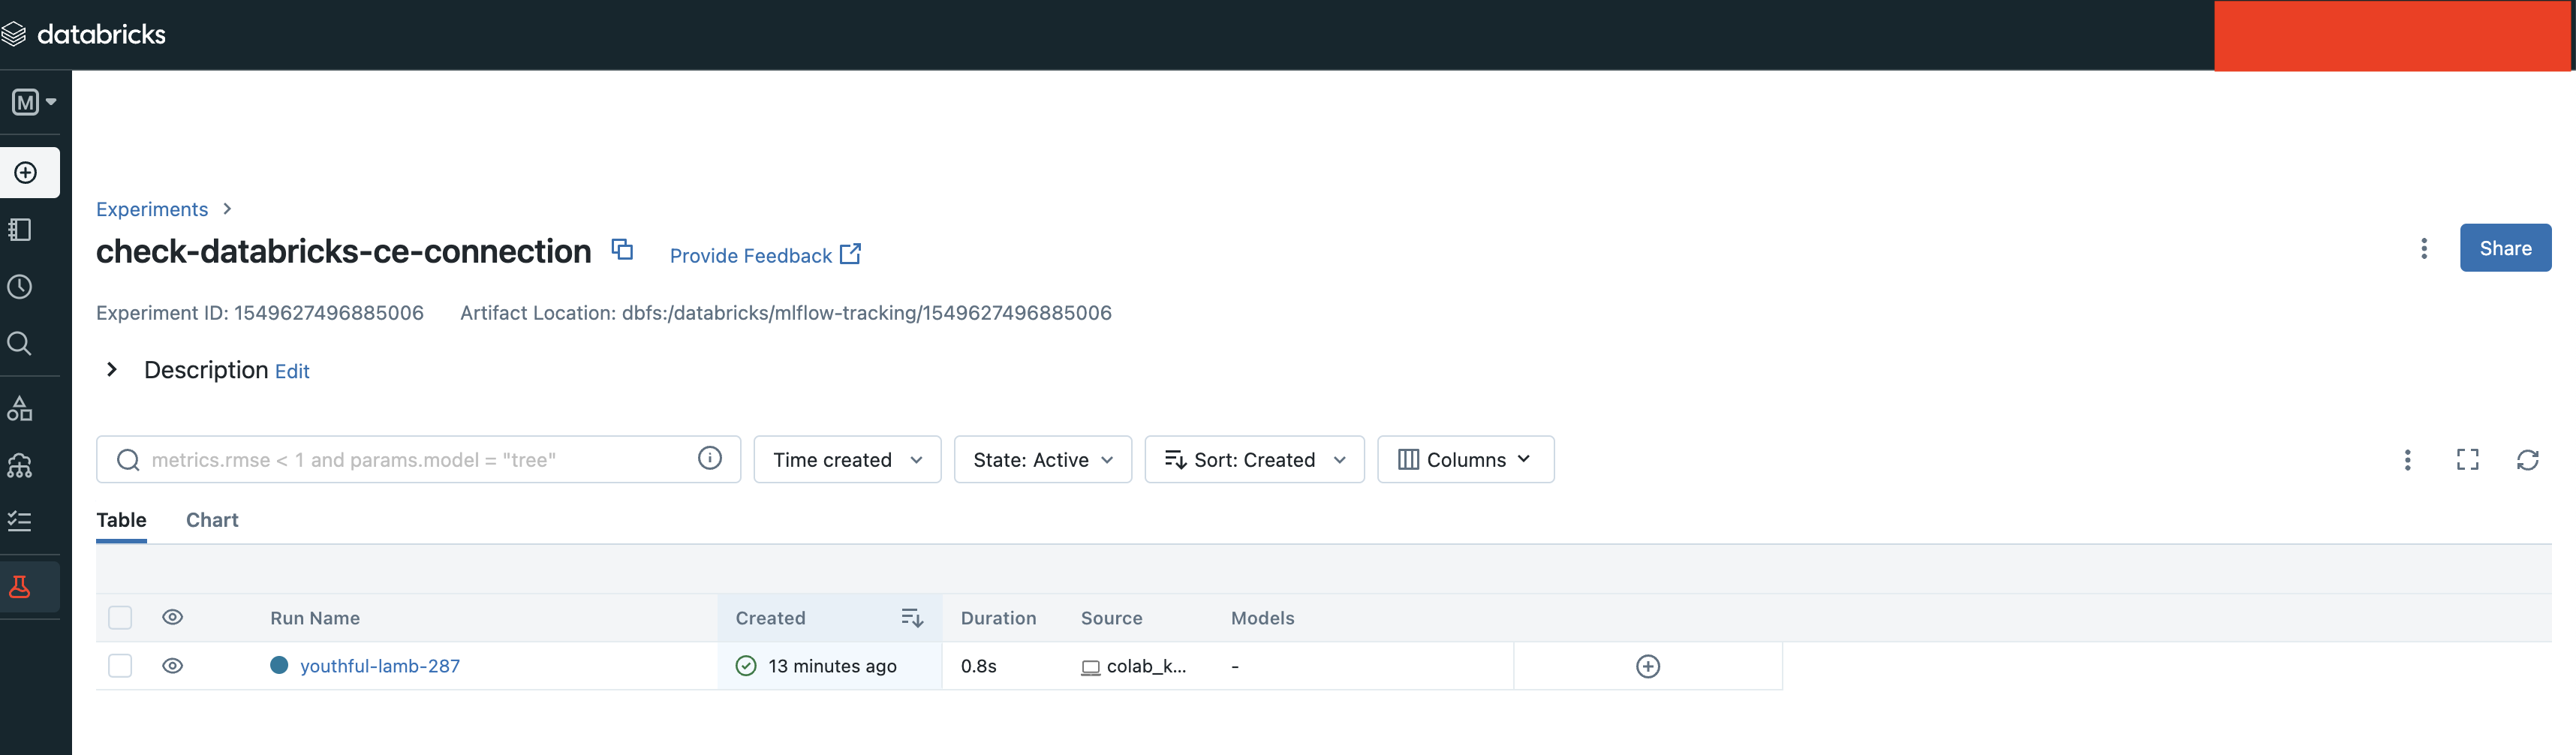
Clicking on the run name, in our example it is “youthful-lamb-287” (it’s a randomly generated name, you will see a different name in your CE console), will bring you to the run view, similar to
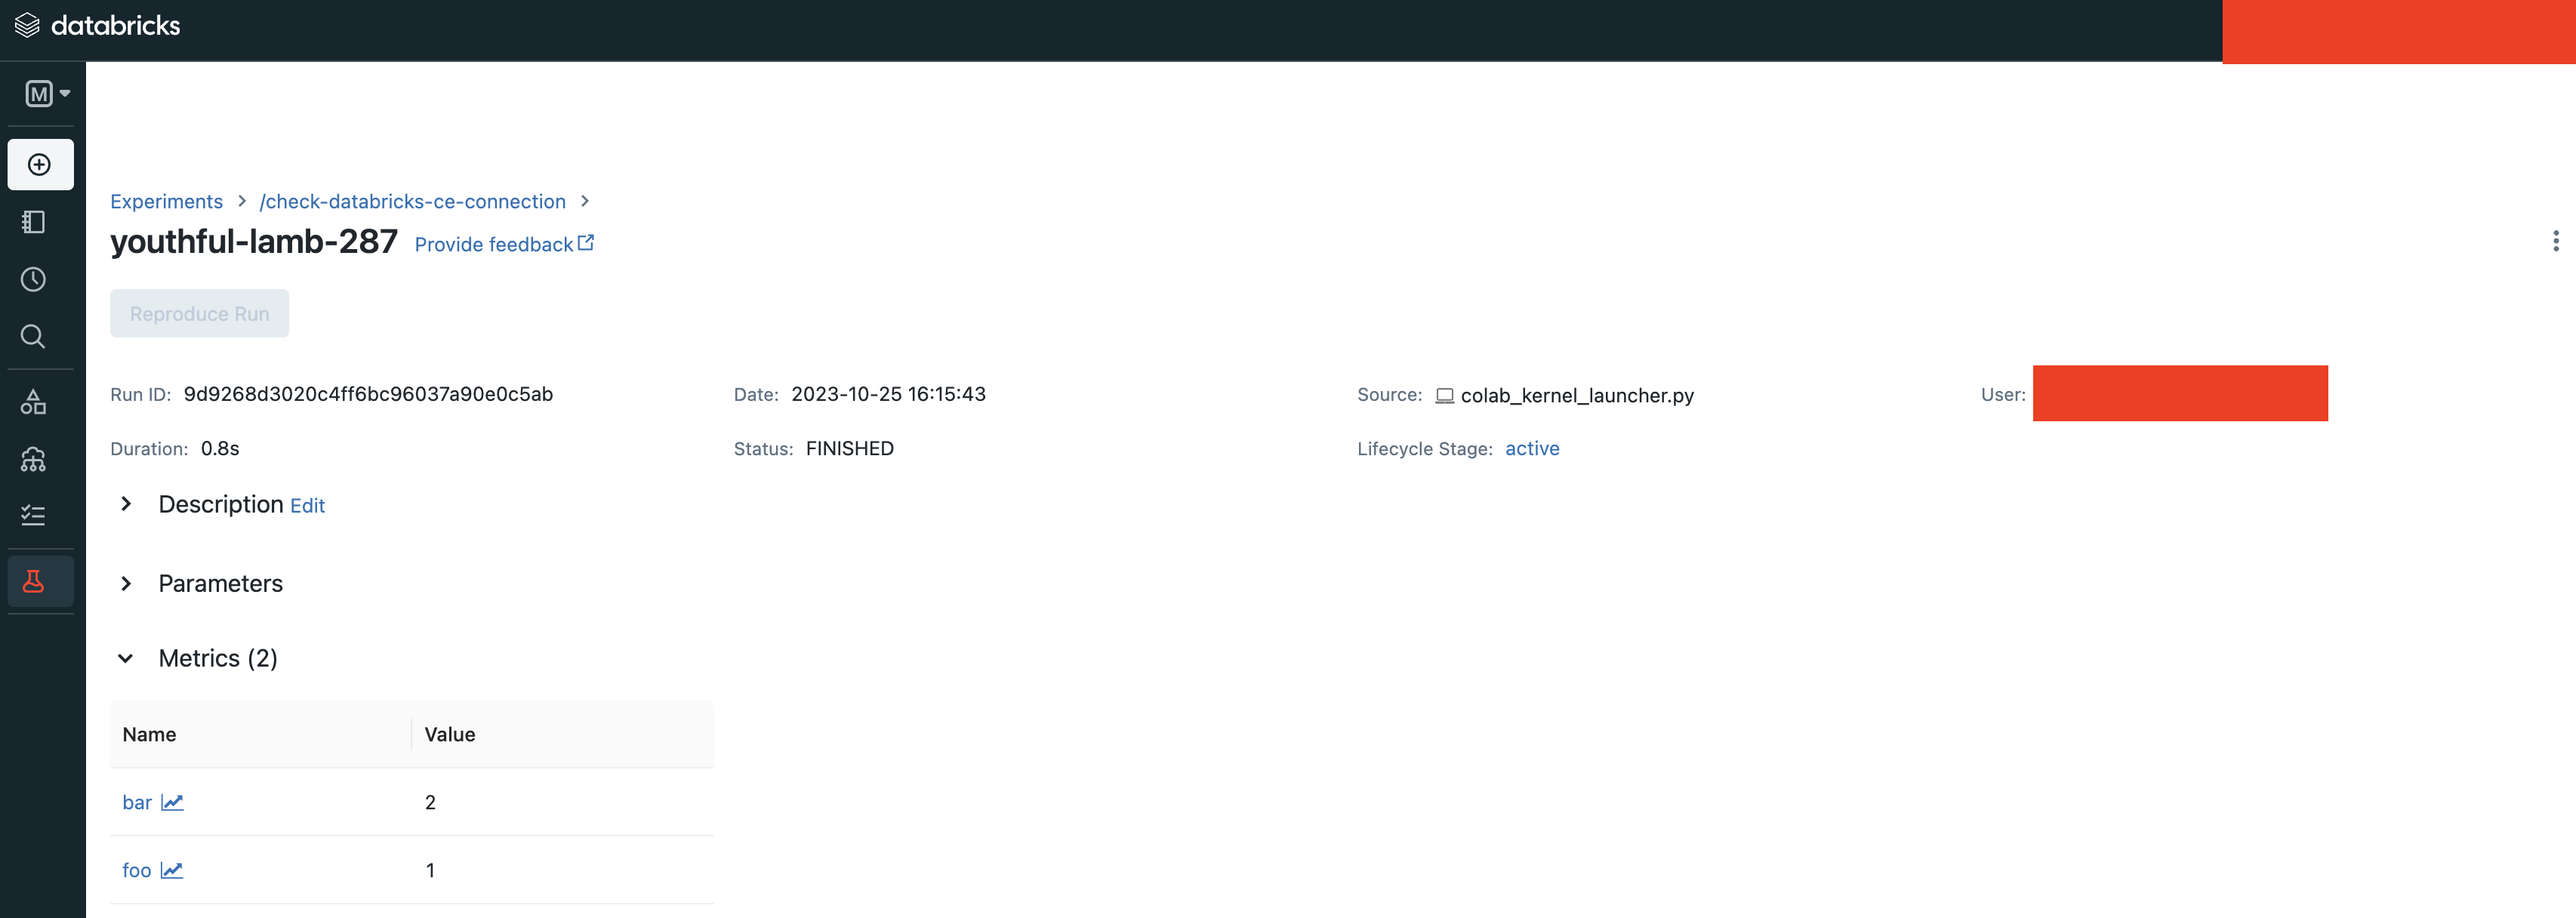
In the run view, you will see our dummy metrics “foo” and “bar” are logged successfully.
Conclusion
That’s all about how to use Databricks CE as the tracking server. Please see the pros and cons of this method below:
Pros
Effortless setup.
Free.
Good for collaboration, e.g., you can share your MLflow experiment with your teammates easily.
Compatible for developing on cloud-based notebook, e.g., Google Colab.
Compatible for developing on cloud VM.
Cons
Has quota limit of experiments/runs.
No model registration/serving support.
Method 3: Use Production Hosted Tracking Server
If you are an enterprise user and willing to productionize your model, you can use a production platform like Databricks or Microsoft AzureML. If you use Databricks, MLflow experiment will log your model into the Databricks MLflow server, and you can register your model then serve your model by a few clicks. Serving feature is only available on production Databricks workspace, and not available on Databricks CE.
The method of using production Databricks is the same as using Databricks CE, you only need to
change the host to be the production workspace. For example, https://dbc-1234567-123.cloud.databricks.com.
For more information about how Databricks power your Machine Learning workflow, please refer to the doc
here.
To use AzureML as the tracking server, please read the doc here
Conclusion
That’s all about how to use a production platform as the tracking server. Please see the pros and cons of this method below:
Pros
Effortless setup.
Good for collaboration, e.g., you can share your MLflow experiment with your teammates easily.
Compatible for developing on cloud-based notebook, e.g., Google Colab.
Compatible for developing on cloud VM.
Seamless model registration/serving support.
Higher quota than Databricks CE (pay as you go).
Cons
Not free.
Need to manage a billing account.