Remote Experiment Tracking with MLflow Tracking Server
In this tutorial, you will learn how to set up MLflow Tracking environment for team development using the MLflow Tracking Server.
There are many benefits to utilize MLflow Tracking Server for remote experiment tracking:
Collaboration: Multiple users can log runs to the same endpoint, and query runs and models logged by other users.
Sharing Results: The tracking server also serves a Tracking UI endpoint, where team members can easily explore each other’s results.
Centralized Access: The tracking server can be run as a proxy for the remote access for metadata and artifacts, making it easier to secure and audit access to data.
How does it work?
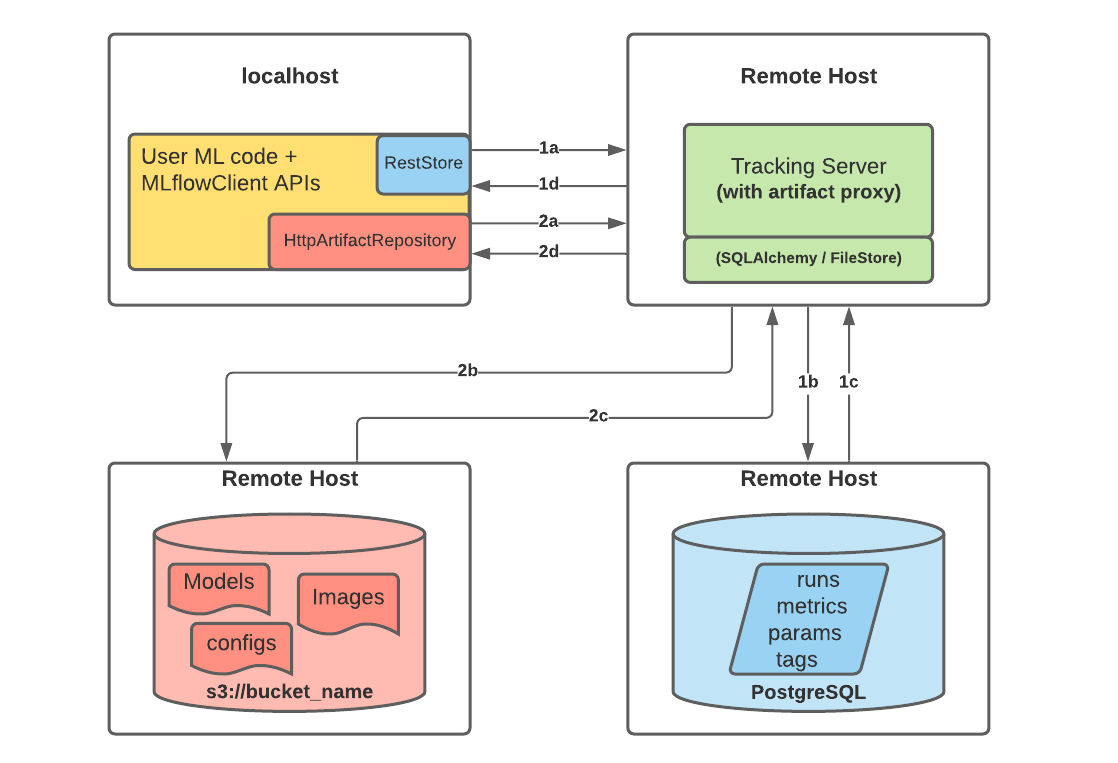
The following picture depicts the architecture of using a remote MLflow Tracking Server with PostgreSQL and S3
Note
You can find the list of supported data stores in the artifact stores and backend stores <../backend-stores.html> documentation guides.
When you start logging runs to the MLflow Tracking Server, the following happens:
Part 1a and b:
The MLflow client creates an instance of a RestStore and sends REST API requests to log MLflow entities
The Tracking Server creates an instance of an SQLAlchemyStore and connects to the remote host for inserting tracking information in the database (i.e., metrics, parameters, tags, etc.)
Part 1c and d:
Retrieval requests by the client return information from the configured SQLAlchemyStore table
Part 2a and b:
Logging events for artifacts are made by the client using the
HttpArtifactRepositoryto write files to MLflow Tracking ServerThe Tracking Server then writes these files to the configured object store location with assumed role authentication
Part 2c and d:
Retrieving artifacts from the configured backend store for a user request is done with the same authorized authentication that was configured at server start
Artifacts are passed to the end user through the Tracking Server through the interface of the
HttpArtifactRepository
Getting Started
Preface
In an actual production deployment environment, you will have multiple remote hosts to run both the tracking server and databases, as shown in the diagram above. However, for the purposes of this tutorial, we will just use a single machine with multiple Docker containers running on different ports, mimicking the remote environment with a far easier evaluation tutorial setup. We will also use MinIO, an S3-compatible object storage, as an artifact store so that you don’t need to have AWS account to run this tutorial.
Step 1 - Get MLflow and additional dependencies
MLflow is available on PyPI. Also pyscopg2 and boto3 are required for accessing PostgreSQL and S3 with Python. If you don’t already have them installed on your system, you can install them with:
pip install mlflow psycopg2 boto3
Step 2 - Set up remote data stores
MLflow Tracking Server can interact with a variety of data stores to store experiment and run data as well as artifacts. In this tutorial, we will use Docker Compose to start two containers, each of them simulating remote servers in an actual environment.
PostgreSQL database as a backend store.
MinIO server as an artifact store.
Install docker and docker-compose
Note
These docker steps are only required for the tutorial purpose. MLflow itself doesn’t depend on Docker at all.
Follow the official instructions for installing Docker and Docker Compose. Then, run docker --version and docker-compose --version to make sure they are installed correctly.
Create compose.yaml
Create a file named compose.yaml with the following content:
version: '3.7'
services:
  # PostgreSQL database
  postgres:
    image: postgres:latest
    environment:
      POSTGRES_USER: user
      POSTGRES_PASSWORD: password
      POSTGRES_DB: mlflowdb
    ports:
      - 5432:5432
    volumes:
      - ./postgres-data:/var/lib/postgresql/data
  # MinIO server
  minio:
    image: minio/minio
    expose:
      - "9000"
    ports:
      - "9000:9000"
      # MinIO Console is available at http://localhost:9001
      - "9001:9001"
    environment:
      MINIO_ROOT_USER: "minio_user"
      MINIO_ROOT_PASSWORD: "minio_password"
    healthcheck:
      test: timeout 5s bash -c ':> /dev/tcp/127.0.0.1/9000' || exit 1
      interval: 1s
      timeout: 10s
      retries: 5
    command: server /data --console-address ":9001"
  # Create a bucket named "bucket" if it doesn't exist
  minio-create-bucket:
    image: minio/mc
    depends_on:
      minio:
        condition: service_healthy
    entrypoint: >
      bash -c "
      mc alias set minio http://minio:9000 minio_user minio_password &&
      if ! mc ls minio | grep --quiet bucket; then
        mc mb minio/bucket
      else
        echo 'bucket already exists'
      fi
      "
Step 3 - Start the Tracking Server
Note
In actual environment, you will have a remote host that will run the tracking server, but in this tutorial we will just use our local machine as a simulated surrogate for a remote machine.
Configure access
For the tracking server to access remote storage, it needs to be configured with the necessary credentials.
export MLFLOW_S3_ENDPOINT_URL=http://localhost:9000 # Replace this with remote storage endpoint e.g. s3://my-bucket in real use cases
export AWS_ACCESS_KEY_ID=minio_user
export AWS_SECRET_ACCESS_KEY=minio_password
You can find the instructions for how to configure credentials for other storages in Supported Storage.
Launch the tracking server
To specify the backend store and artifact store, you can use the --backend-store-uri and --artifacts-store-uri options respectively.
mlflow server \
  --backend-store-uri postgresql://user:password@localhost:5432/mlflowdb \
  --artifacts-destination s3://bucket \
  --host 0.0.0.0 \
  --port 5000
Replace localhost with the remote host name or IP address for your database server in actual environment.
Step 4: Logging to the Tracking Server
Once the tracking server is running, you can log runs to it by setting the MLflow Tracking URI to the tracking server’s URI. Alternatively, you can use the mlflow.set_tracking_uri() API to set the tracking URI.
export MLFLOW_TRACKING_URI=http://127.0.0.1:5000 # Replace with remote host name or IP address in an actual environment
Then run your code with MLflow tracking APIs as usual. The following code runs training for a scikit-learn RandomForest model on the diabetes dataset:
import mlflow

from sklearn.model_selection import train_test_split
from sklearn.datasets import load_diabetes
from sklearn.ensemble import RandomForestRegressor

mlflow.autolog()

db = load_diabetes()
X_train, X_test, y_train, y_test = train_test_split(db.data, db.target)

# Create and train models.
rf = RandomForestRegressor(n_estimators=100, max_depth=6, max_features=3)
rf.fit(X_train, y_train)

# Use the model to make predictions on the test dataset.
predictions = rf.predict(X_test)
Step 5: View logged Run in Tracking UI
Our pseudo-remote MLflow Tracking Server also hosts the Tracking UI on the same endpoint. In an actual deployment environment with a remote tracking server, this is also the case. You can access the UI by navigating to http://127.0.0.1:5000 (replace with remote host name or IP address in actual environment) in your browser.
Step 6: Download artifacts
MLflow Tracking Server also serves as a proxy host for artifact access. Artifact access is enabled through the proxy URIs such as runs:/, mlflow-artifacts:/,
giving users access to this location without having to manage credentials or permissions of direct access.
import mlflow

run_id = "YOUR_RUN_ID"  # You can find run ID in the Tracking UI
artifact_path = "model"

# Download artifact via the tracking server
mlflow_artifact_uri = f"runs://{run_id}/{artifact_path}"
local_path = mlflow.artifacts.download_artifacts(mlflow_artifact_uri)

# Load the model
model = mlflow.sklearn.load_model(local_path)
What’s Next?
Now you have learned how to set up MLflow Tracking Server for remote experiment tracking! There are a couple of more advanced topics you can explore:
Other configurations for the Tracking Server: By default, MLflow Tracking Server serves both backend store and artifact store. You can also configure the Tracking Server to serve only backend store or artifact store, to handle different use cases such as large traffic or security concerns. See other use cases for how to customize the Tracking Server for these use cases.
Secure the Tracking Server: The
--hostoption exposes the service on all interfaces. If running a server in production, we would recommend not exposing the built-in server broadly (as it is unauthenticated and unencrypted). Read Secure Tracking Server for the best practices to secure the Tracking Server in production.New Features: The MLflow team and a host of community contributors constantly develops new features to support broader use cases. See New Features to catch up with the latest features!