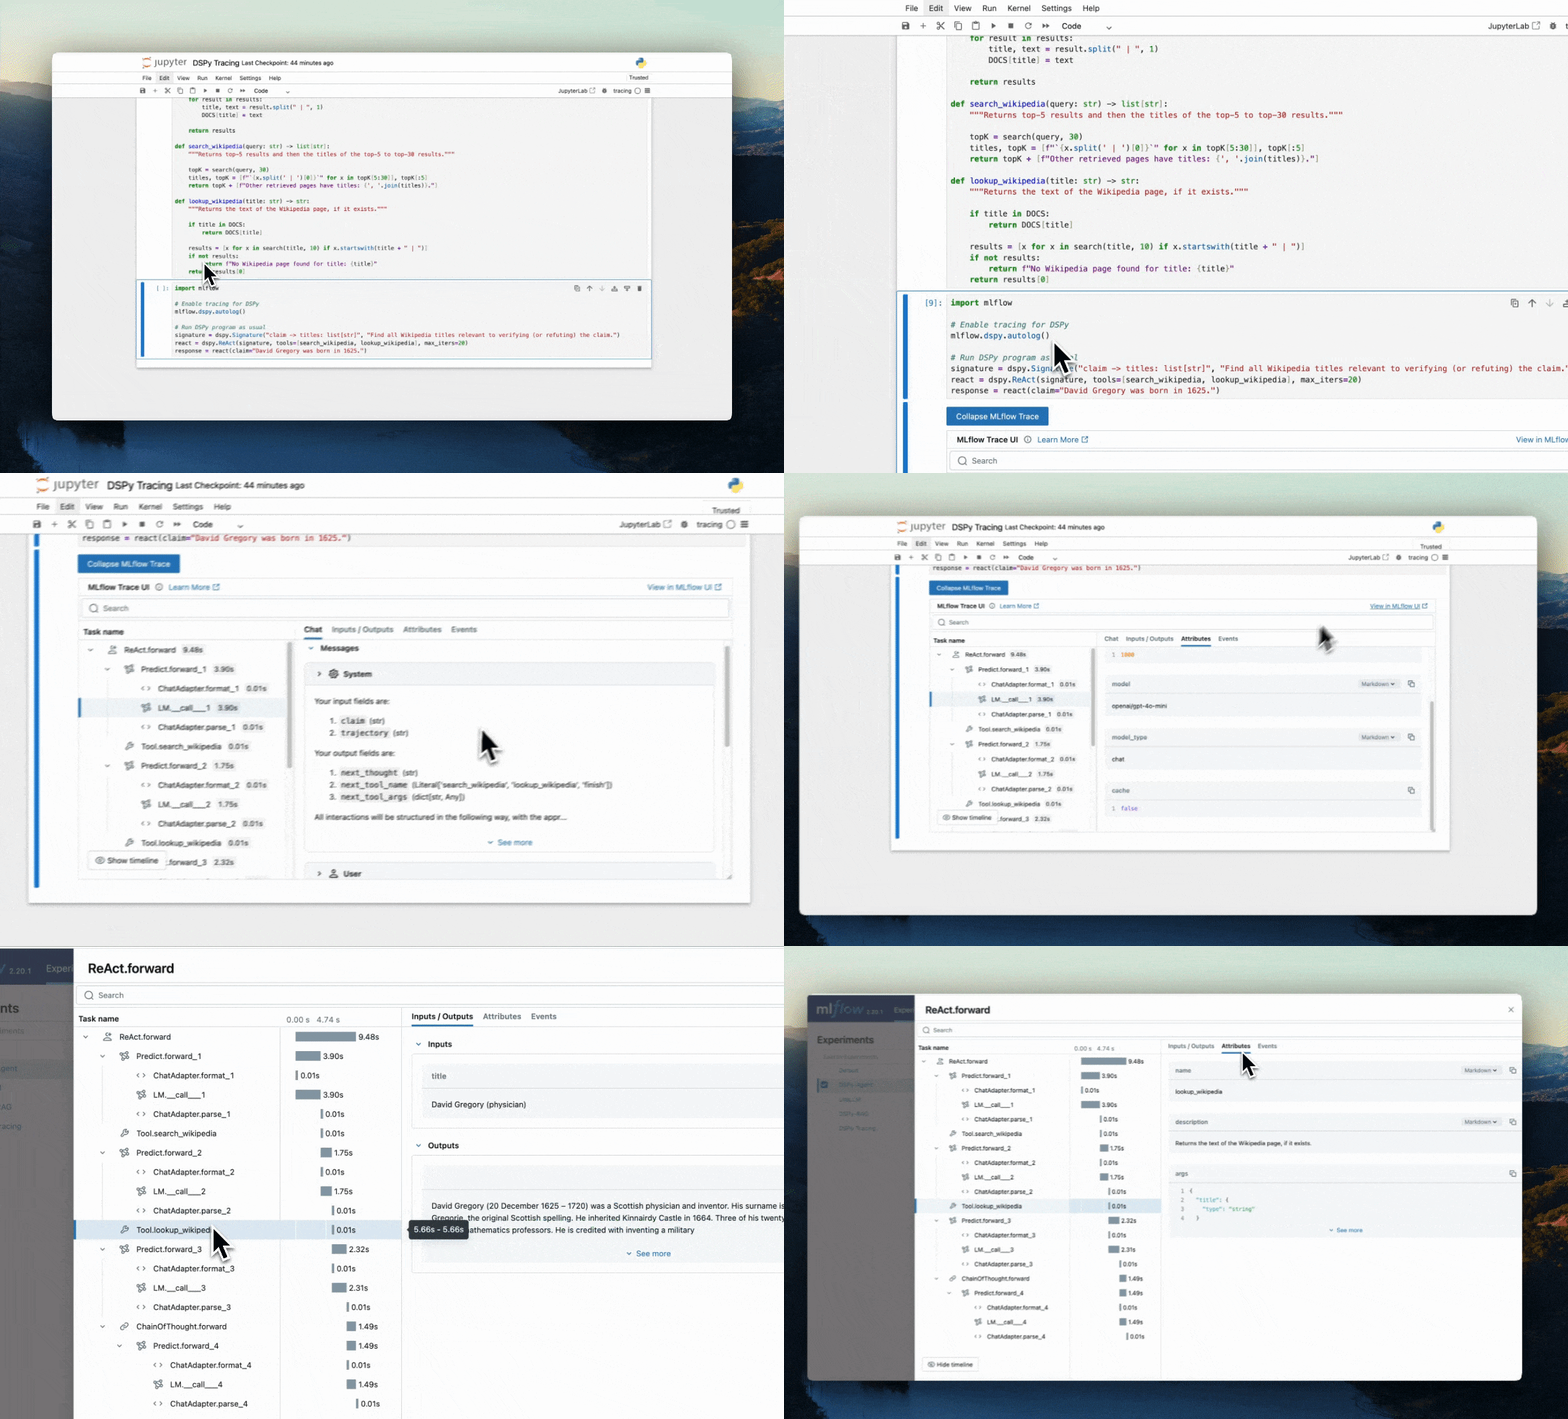
Tracing DSPy🧩

DSPy is an open-source framework for building modular AI systems and offers algorithms for optimizing their prompts and weights.
MLflow Tracing provides automatic tracing capability for DSPy. You can enable tracing
for DSPy by calling the mlflow.dspy.autolog() function, and nested traces are automatically logged to the active MLflow Experiment upon invocation of DSPy modules.
import mlflow

mlflow.dspy.autolog()
MLflow DSPy integration is not only about tracing. MLflow offers full tracking experience for DSPy, including model tracking, index management, and evaluation. Please checkout the MLflow DSPy Flavor to learn more!
Example Usage
import dspy
import mlflow

# Enabling tracing for DSPy
mlflow.dspy.autolog()

# Optional: Set a tracking URI and an experiment
mlflow.set_tracking_uri("http://localhost:5000")
mlflow.set_experiment("DSPy")

# Define a simple ChainOfThought model and run it
lm = dspy.LM("openai/gpt-4o-mini")
dspy.configure(lm=lm)


# Define a simple summarizer model and run it
class SummarizeSignature(dspy.Signature):
    """Given a passage, generate a summary."""

    passage: str = dspy.InputField(desc="a passage to summarize")
    summary: str = dspy.OutputField(desc="a one-line summary of the passage")


class Summarize(dspy.Module):
    def __init__(self):
        self.summarize = dspy.ChainOfThought(SummarizeSignature)

    def forward(self, passage: str):
        return self.summarize(passage=passage)


summarizer = Summarize()
summarizer(
    passage=(
        "MLflow Tracing is a feature that enhances LLM observability in your Generative AI (GenAI) applications "
        "by capturing detailed information about the execution of your application's services. Tracing provides "
        "a way to record the inputs, outputs, and metadata associated with each intermediate step of a request, "
        "enabling you to easily pinpoint the source of bugs and unexpected behaviors."
    )
)
Tracing during Evaluation
Evaluating DSPy models is an important step in the development of AI systems. MLflow Tracing can help you track the performance of your programs after the evaluation, by providing detailed information about the execution of your programs for each input.
When MLflow auto-tracing is enabled for DSPy, traces will be automatically generated when you execute DSPy's built-in evaluation suites. The following example demonstrates how to run evaluation and review traces in MLflow:
import dspy
from dspy.evaluate.metrics import answer_exact_match

import mlflow

# Enabling tracing for DSPy evaluation
mlflow.dspy.autolog(log_traces_from_eval=True)

# Define a simple evaluation set
eval_set = [
    dspy.Example(
        question="How many 'r's are in the word 'strawberry'?", answer="3"
    ).with_inputs("question"),
    dspy.Example(
        question="How many 'a's are in the word 'banana'?", answer="3"
    ).with_inputs("question"),
    dspy.Example(
        question="How many 'e's are in the word 'elephant'?", answer="2"
    ).with_inputs("question"),
]


# Define a program
class Counter(dspy.Signature):
    question: str = dspy.InputField()
    answer: str = dspy.OutputField(
        desc="Should only contain a single number as an answer"
    )


cot = dspy.ChainOfThought(Counter)

# Evaluate the programs
with mlflow.start_run(run_name="CoT Evaluation"):
    evaluator = dspy.evaluate.Evaluate(
        devset=eval_set,
        return_all_scores=True,
        return_outputs=True,
        show_progress=True,
    )
    aggregated_score, outputs, all_scores = evaluator(cot, metric=answer_exact_match)

    # Log the aggregated score
    mlflow.log_metric("exact_match", aggregated_score)
    # Log the detailed evaluation results as a table
    mlflow.log_table(
        {
            "question": [example.question for example in eval_set],
            "answer": [example.answer for example in eval_set],
            "output": outputs,
            "exact_match": all_scores,
        },
        artifact_file="eval_results.json",
    )
If you open the MLflow UI and go to the "CoT Evaluation" run, you will see the evaluation result, and the list of traces generated during the evaluation on the Traces tab.
You can disable tracing for these steps by calling the mlflow.dspy.autolog() function with the log_traces_from_eval parameters set to False.
Tracing during Compilation (Optimization)
Compilation (optimization) is the core concept of DSPy. Through compilation, DSPy automatically optimizes the prompts and weights of your DSPy program to achieve the best performance.
By default, MLflow does NOT generate traces during complication, because complication can trigger hundreds or thousands of invocations of DSPy modules. To enable tracing for compilation, you can call the mlflow.dspy.autolog() function with the log_traces_from_compile parameter set to True.
import dspy
import mlflow

# Enable auto-tracing for compilation
mlflow.dspy.autolog(log_traces_from_compile=True)

# Optimize the DSPy program as usual
tp = dspy.MIPROv2(metric=metric, auto="medium", num_threads=24)
optimized = tp.compile(cot, trainset=trainset)
Disable auto-tracing
Auto tracing for LlamaIndex can be disabled globally by calling mlflow.llama_index.autolog(disable=True) or mlflow.autolog(disable=True).