How to Run Tutorials
This brief guide will walk you through some options that you have to run these tutorials and have a Tracking Server that is available to log the results to (as well as offering options for the MLflow UI).
The listing of topics in this guide are in ascending order of complexity, so if you’re looking for the quickest and easiest way to get started, please evaluate the first option.
Databricks
The easiest way to get started with MLflow is to use the managed MLflow service provided by Databricks. There are two separate options here, one that is most expedient if you’re a Databricks customer, and another that is available to anyone, free of charge.
Databricks Customers
If you’re already a customer of Databricks, you can use the MLflow service that is available as part of your Databricks workspace. MLflow on Databricks is a fully managed service with additional functionality for enterprise customers, providing a scalable and secure managed deployment of MLflow. Note that the MLflow APIs from within Databricks are the same as the open source version, so you can use the same code to run on Databricks or on your own infrastructure.
To learn how to get started using MLflow from within your Databricks account, please see the respective links below for your cloud provider:
Databricks Community Edition
The Databricks Community Edition (CE) is a fully managed, Databricks-hosted version of the Databricks platform. While many of the enterprise features of the Databricks platform are unavailble on CE, the vast majority of MLflow functionality is supported (with the notable exception that you cannot create serving endpoints on CE, so deployment of models is not supported).
To get started with Databricks CE, please visit the Databricks Community Edition page and follow the instructions outlined there. It takes about 5 minutes to get started, and you’ll have a (mostly) fully functional Databricks Workspace that you can use to log your tutorial experiments, runs, and artifacts to.
Once you log in to the Community Edition, you will see a landing page like this:
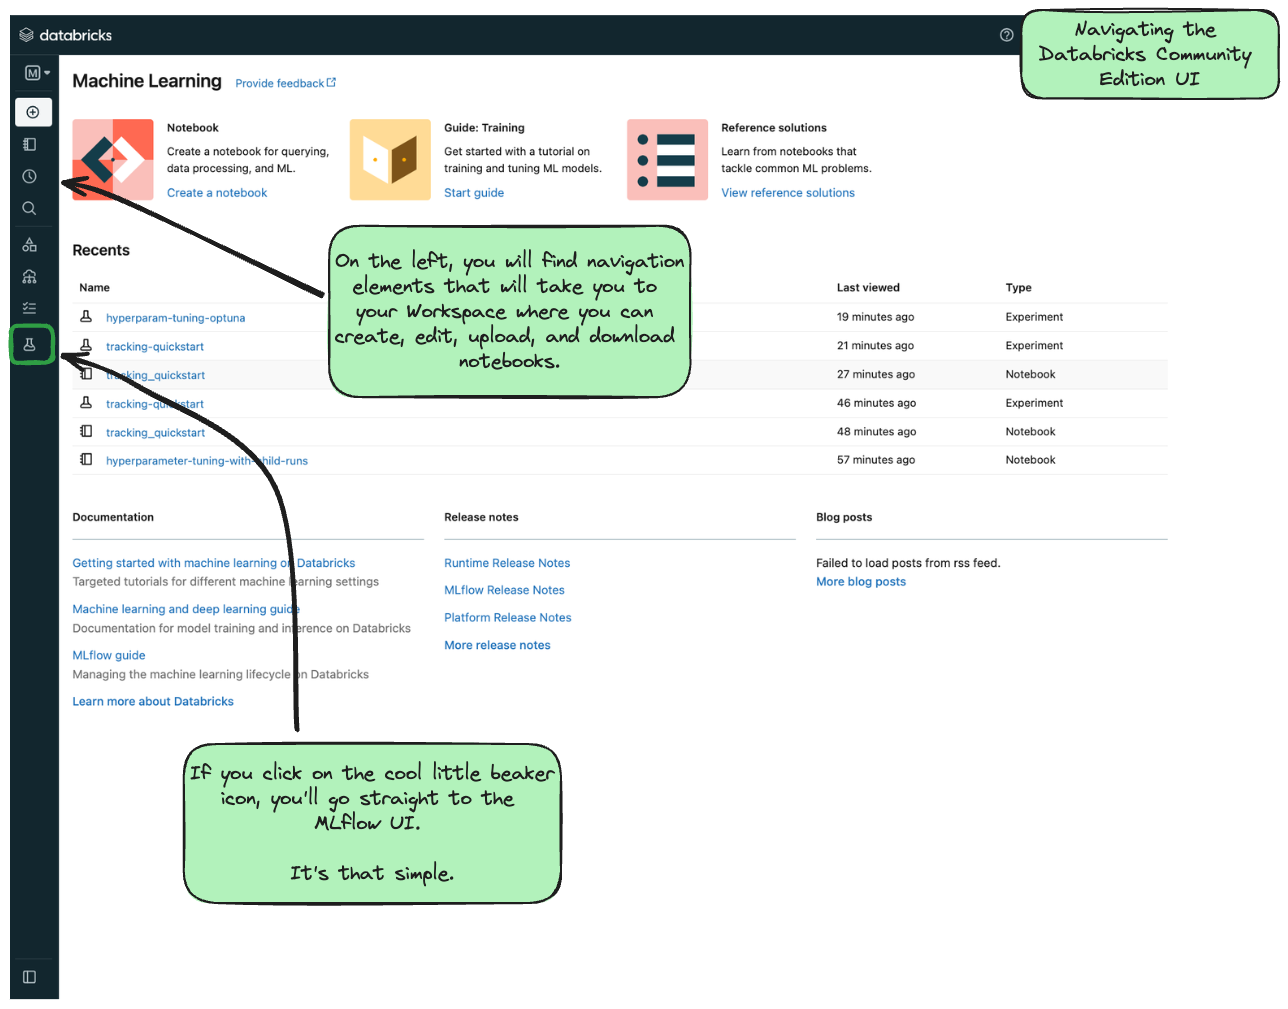
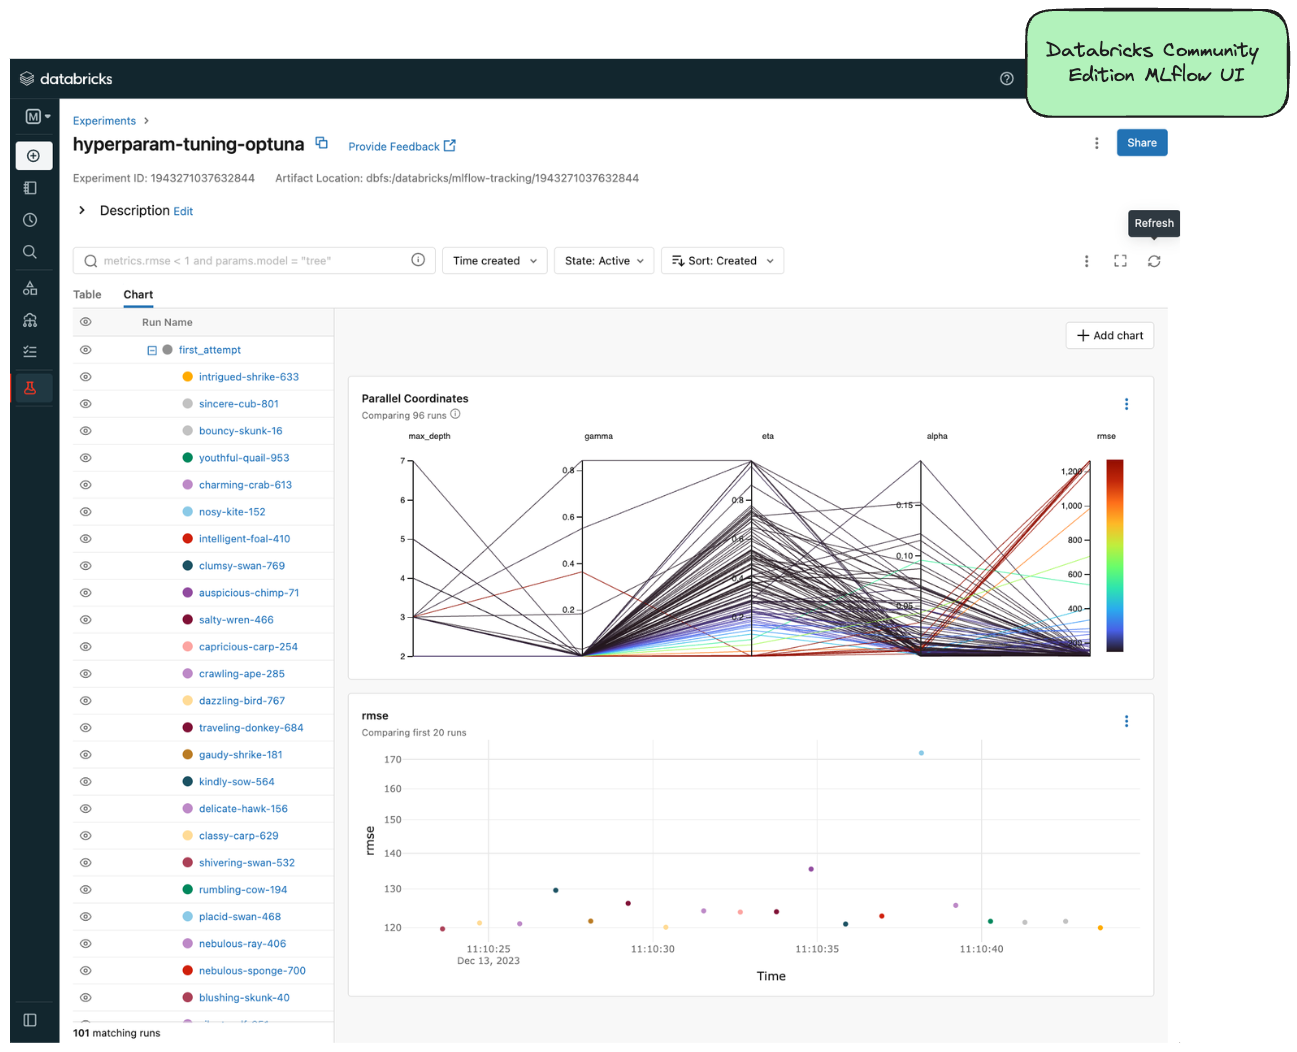
In order to get to the MLflow UI, you can navigate to it by clicking on the “Experiments” link on the left-hand side (denoted by the laboratory beaker icon). When you get to the MLflow UI on CE for the first time, you’ll see this:
Decisions about where to run your Notebook
With a Databricks managed instance of MLflow, you have two options for running the tutorial notebooks:
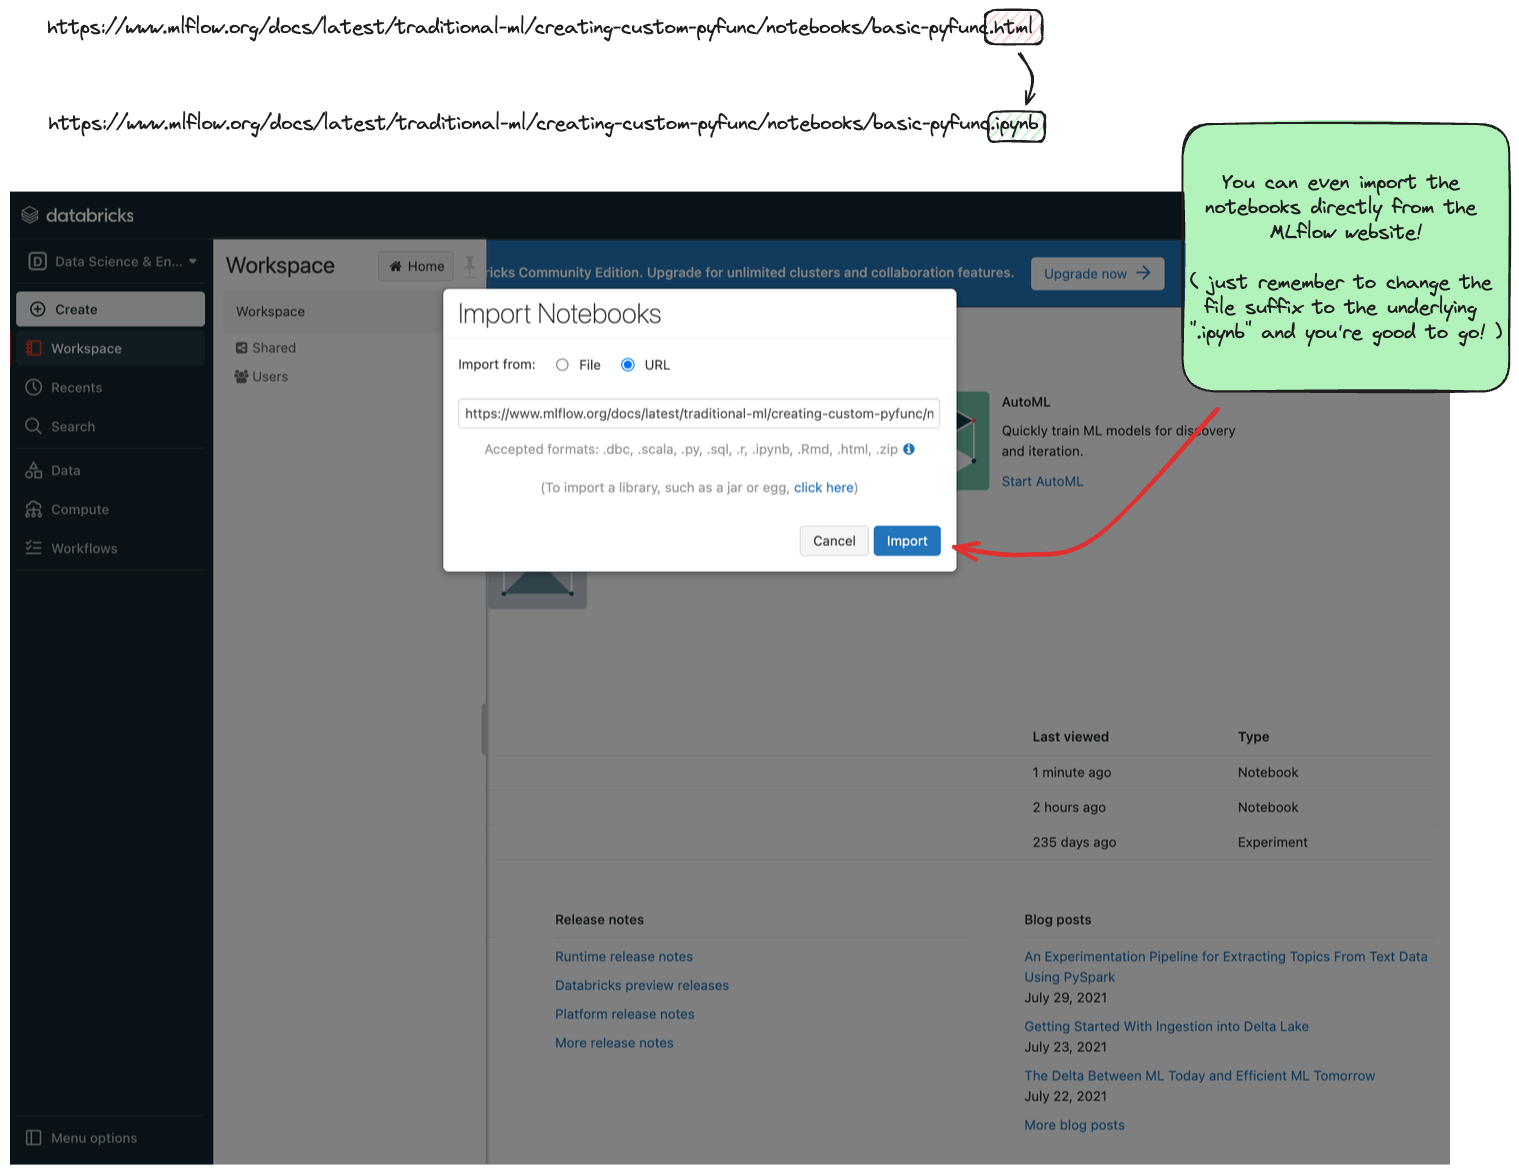
Expand to learn about Importing Notebooks directly into CE
Once you're at the main page of CE, you can import any of the notebooks within this tutorial by navigating to the "Workspace" tab on the left.
Click that link to expand the file navigation pane. From there, navigate to Users/<you> and you can right click to bring up the "Import" option.
The below image shows what the import dialog should look like if you're going to directly import a notebook from the MLflow documentation website:
At this point, you can simply just run the tutorial.
Any calls to MLflow for creating experiments, initiating runs, logging metadata, and saving artifacts will be fully managed for you and your logging history will appear within the MLflow UI.
Expand to learn about Running Notebooks locally and using CE as a remote tracking server
In order to stay within the comfortable confines of your local machine and still have the use of the managed MLflow Tracking Server, you can simply add a call to mlflow.login() to your notebook. This will generate a prompt for you to enter your username and password that were defined when creating your account on CE.
Note: your username will be the email address that you used when signing up.
    import mlflow

    mlflow.login()
After the login process is done, you will simply have to set your MLflow Tracking URI to the instance that you just logged in to.
It's made fairly easy for you:
mlflow.set_tracking_uri("databricks")
At this point, you’re ready to go! You can run any of the tutorials locally and they will log to the managed MLflow Tracking Server.
Self-managed MLflow
If you have your own managed MLflow server that you’d like to use, you can simply set the MLflow Tracking URI to point to your server. If there are additional configurations or access restrictions for connecting, please contact the group that manages your MLflow deployment for more information.
To set the MLflow Tracking URI directly (assuming that you don’t have additional security validation set up), all you need to do is, from within a notebook:
mlflow.set_tracking_uri(
    "http://<your-mlflow-server>:<the port number that is configured to accept traffic>"
)
Local Tracking Server
Learn how to run an MLflow Tracking Server locally by following the quickstart tutorial here.
Learn more about the MLflow Tracking Server by reading the Tracking Server Overview and how to deploy a tracking server guides.